| Issue |
A&A
Volume 583, November 2015
|
|
|---|---|---|
| Article Number | A73 | |
| Number of page(s) | 21 | |
| Section | Stellar structure and evolution | |
| DOI | https://doi.org/10.1051/0004-6361/201526129 | |
| Published online | 29 October 2015 | |
Online material
Appendix A: Additional table
Rotation periods of the M 48 stars.
Appendix B: Additional figures
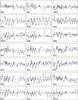 |
Fig. B.1
Light curves 1 (Q = 2 periods in parentheses, x-units = 10 d, y-units = 0.01 mag). |
| Open with DEXTER | |
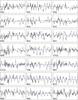 |
Fig. B.2
Light curves 2 (Q = 2 periods in parentheses, x-units = 10 d, y-units = 0.01 mag). |
| Open with DEXTER | |
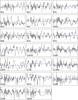 |
Fig. B.3
Light curves 3 (Q = 2 periods in parentheses, x-units = 10 d, y-units = 0.01 mag). |
| Open with DEXTER | |
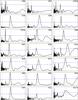 |
Fig. B.4
Spectra 1 (Q = 2 periods in parentheses, x-units = 1 d, y-units arbitrary, selected rotation period marked with green line, 5σ level marked with blue line. |
| Open with DEXTER | |
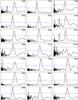 |
Fig. B.5
Spectra 2 (Q = 2 periods in parentheses, x-units = 1 d, y-units arbitrary, selected rotation period marked with green line, 5σ level marked with blue line). |
| Open with DEXTER | |
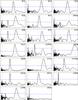 |
Fig. B.6
Spectra 3 (Q = 2 periods in parentheses, x-units = 1 d, y-units arbitrary, selected rotation period marked with green line, 5σ level marked with blue line). |
| Open with DEXTER | |
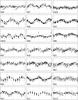 |
Fig. B.7
Phased curves 1 (Q = 2 periods in parentheses, x-units = 1 d, y-units = 0.01 mag), with two phases displayed for each star. |
| Open with DEXTER | |
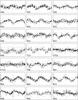 |
Fig. B.8
Phased curves 2 (Q = 2 periods in parentheses, x-units = 1 d, y-units = 0.01 mag), with two phases displayed for each star. |
| Open with DEXTER | |
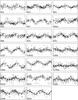 |
Fig. B.9
Phased curves 3 (Q = 2 periods in parentheses, x-units = 1 d, y-units = 0.01 mag), with two phases displayed for each star. |
| Open with DEXTER | |
© ESO, 2015
Current usage metrics show cumulative count of Article Views (full-text article views including HTML views, PDF and ePub downloads, according to the available data) and Abstracts Views on Vision4Press platform.
Data correspond to usage on the plateform after 2015. The current usage metrics is available 48-96 hours after online publication and is updated daily on week days.
Initial download of the metrics may take a while.