| Issue |
A&A
Volume 581, September 2015
|
|
|---|---|---|
| Article Number | A4 | |
| Number of page(s) | 21 | |
| Section | Interstellar and circumstellar matter | |
| DOI | https://doi.org/10.1051/0004-6361/201425521 | |
| Published online | 21 August 2015 | |
Online material
Appendix A: Complementary single-dish CO observations
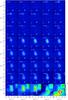 |
Fig. A.1
Map of the CO J = 2–1 emission integrated in channels of 3.25km from −13.5 to +113.1 km s-1, as observed with the IRAM 30 m telescope. The position of the protostar is marked by a red star. The positions targeted by GREAT/SOFIA and HIFI/Herschel are marked by blue stars. The size of the telescope HPBW (10.7″) is indicated by the white circle. |
| Open with DEXTER | |
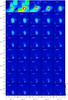 |
Fig. A.2
Map of the CO J = 2–1 emission integrated in channels of 3.25km from −137.0 to −10.3 km s-1, as observed with the IRAM 30 m telescope. The position of the protostar is marked by a red star. The positions targeted by GREAT/SOFIA and HIFI/Herschel are marked by blue stars. The size of the telescope HPBW (10.7″) is indicated by the white circle. |
| Open with DEXTER | |
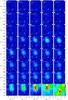 |
Fig. A.3
Map of the CO J = 3–2 emission integrated in channels of 3.25km from −13.5 to +113.1 km s-1, as observed with the JCMT. The position of the protostar is marked by a red star. The positions targeted by GREAT/SOFIA and HIFI/Herschel are marked by blue stars. The size of the telescope HPBW (15″) is indicated by the white circle. |
| Open with DEXTER | |
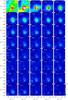 |
Fig. A.4
Map of the CO J = 3–2 emission integrated in channels of 3.25km from −137 to −10.3 km s-1, as observed with the JCMT. The position of the protostar is marked by a red star. The positions targeted by GREAT/SOFIA and HIFI/Herschel are marked by blue stars. The size of the telescope HPBW (15″) is indicated by the white circle. |
| Open with DEXTER | |
Appendix B: Excitation conditions in the outflow cavity
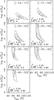 |
Fig. B.1
χ2 distribution of LVG slab models for different velocity intervals in the low-excitation gas of the outflow cavity. The considered velocity intervals are indicated in each panel. The minimum value |
| Open with DEXTER | |
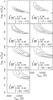 |
Fig. B.2
χ2 distribution of LVG slab models for different velocity intervals in the high-excitation gas of the outflow cavity. The considered velocity intervals are indicated in each panel. The minimum value |
| Open with DEXTER | |
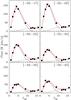 |
Fig. B.3
Best fitting solutions of the CO spectral line flux distribution as a function of the rotational number of the transition from our LVG analysis with the MADEX radiative transfer code. The fits to the low- and high-excitation components are shown by black solid and dashed lines, respectively. The fit to the total flux is shown in red. |
| Open with DEXTER | |
© ESO, 2015
Current usage metrics show cumulative count of Article Views (full-text article views including HTML views, PDF and ePub downloads, according to the available data) and Abstracts Views on Vision4Press platform.
Data correspond to usage on the plateform after 2015. The current usage metrics is available 48-96 hours after online publication and is updated daily on week days.
Initial download of the metrics may take a while.