| Issue |
A&A
Volume 580, August 2015
|
|
|---|---|---|
| Article Number | A64 | |
| Number of page(s) | 14 | |
| Section | Stellar atmospheres | |
| DOI | https://doi.org/10.1051/0004-6361/201526066 | |
| Published online | 03 August 2015 | |
Online material
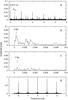 |
Fig. 12
Fourier spectrum of the FK Com V light curve in those years where Hα observations exist. a) whole spectrum, b) is zoomed into the long-period region, and c) shows the zoomed-in spectrum after pre-whitening with the 6.8 yr-long period. Bottom plot d) spectral window. |
| Open with DEXTER | |
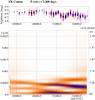 |
Fig. 13
ΔV light curve (top) and its time–frequency analysis using the STFT (short-time Fourier transform) method (bottom) showing multiple activity cycles of changing length on FK Comae. |
| Open with DEXTER | |
Appendix A: Comparison between the different activity features
In the following, we give a detailed description of the Hα activity in those cases where indications of a prominence was seen and their possible connection with photospheric features:
-
1998.27/1998.30.
The prominence crossed the stellar disk at≈ 0.8 − 0.9 phase. The 1998.27 set shows steady Hα emission, but there is a flare in the 1998.30 set at phase 0.9. The light curve shows a minimum around 0.75 phase. The Doppler image in Korhonen et al. (2007) shows high-latitude spots at phases 0.34−0.52 and 0.78−1.00. The flare, the dark spots, and the prominence coincide in phase.
-
In the 1999.41 observations, we see a prominence at phase ≈ 0.2. The light curve shows a minimum at phase 0.9 and a maximum at 0.4. The Doppler image from 1999 May shows a polar spot, high-latitude spots at phases 0.6 and 1.0, and a southern spot at 0.97, but the one from 1999 July shows a much weaker spottedness around the same phases and no polar spot. In this case the prominence is close to the brightest phase of the star. In both May and July, there are brighter regions in the maps around the 0.25 phase: in May we see two bright areas on the northern hemisphere, while in July it was found on the southern part. 1999.58 is the only case where we see a strong indication of two coinciding prominence loops in the Hα dynamic spectra, one around the 0.5−0.6 phase and one at Phase 1.0.
-
2000.33.
We see a prominence crossing the stellar disk at 0.7 in phase. The light curve at this epoch shows a minimum at Phase 0.7 and a maximum at 0.3. The Doppler map from 2000 March shows high-latitude spots around Phases 0.5−0.64, and the one from 2000 April has dark features around 0.23, 0.52−0.66, 0.59−0.70, 0.78−0.84, 0.97 phases in different latitudes. This latter map was marked in the paper as less reliable. The spotted regions between Phases 0.5 and 0.8 are present in both maps, and one of these might be connected with the prominence.
-
The light curve in this epoch shows a very symmetric sinusoidal shape with a minimum at 0.46 and a maximum at 0.97 in phase. In this case the wave-like Hα structure at phase ≈ 0.5 in Fig. 2 is less obvious; probably the prominence is hidden by the stellar disk around Phase 1.0. This suggests a low-latitude feature. The Doppler map from 2001 May shows the strongest features – both dark and bright regions – around 0.25 phase, although this map was marked as less reliable. The following map from 2001 June shows two high-latitude spots at phases 0.20−0.38 and 0.54−0.74, an equatorial spot at 0.49, and a brighter feature around phase 0.5.
-
2004.10.
The light curve in this epoch is a sinusoidal one with a minimum at 0.95 and a maximum at 0.43. The closest Doppler image is from 2004 July, shown in Fig. 5. (In July the shape of the light curve is similar to that in February, but the amplitude is higher and the maximum is around Phase 0.55.) In this map the most pronounced features are two dark spots: a mid-latitude one around Phase 0.1 and a high-latitude one between Phases 0.2 and 0.3. The dynamic spectrum shows that the prominence is crossing the stellar disk at ≈ 0.5 phase. The wave-like shape in the radial velocity is somewhat distorted, which could be a result of a mass ejection. We can see an increased level of Hα emission at Phase 0.7, which could be originating in the prominence. According to both the Doppler maps and the light curves, there is possibly no connection between the dark photospheric spots and the prominence in this case.
-
2004.58.
The prominence crosses the stellar disk around phase 0.05, which is close in phase both to the light curve minimum and to the large dark spots seen in the Doppler maps.
-
2007.56.
The light curve shows a minimum at Phase 0.8 and a maximum around Phase 0.27. The Doppler map in Fig. 5 is very interesting, because it is dominated by both bright and dark spots between Phases 0.55 and 1.00, with dark spots from the southern hemisphere reaching to higher latitudes and a bright elongated feature at ≈ 45° latitude. The dynamic spectrum shows a broad wave-like feature, indicating a prominence crossing the stellar disk around Phase 0.6, close to both the light curve minimum and the spots found in the Doppler maps.
-
2009.67.
The Doppler maps from 2009.67 and 2010.00 are quite similar since both have a spot group around phase 0.25 at relatively low latitudes. The temperature contrast is low, about 500 K cooler than the unspotted surface in 2009 August and 600 K as in 2010 January. There is no sign of a polar spot. There is no photometric observation during this 2009.67 period, but the light curve before these observations is a sinusoidal one with a minimum at Phase 0.32 and a maximum at 0.78. The following ΔV data show similar behaviour to the previous one with an additional secondary minimum around phase 0.65. The dynamic spectrum is very interesting because it shows an obvious wave-like structure, but the general level of the Hα emission is very low, barely higher than the lowest observed one. The source of the emission crosses the stellar disk at Phase 0.3.
© ESO, 2015
Current usage metrics show cumulative count of Article Views (full-text article views including HTML views, PDF and ePub downloads, according to the available data) and Abstracts Views on Vision4Press platform.
Data correspond to usage on the plateform after 2015. The current usage metrics is available 48-96 hours after online publication and is updated daily on week days.
Initial download of the metrics may take a while.