| Issue |
A&A
Volume 580, August 2015
|
|
|---|---|---|
| Article Number | A22 | |
| Number of page(s) | 25 | |
| Section | Cosmology (including clusters of galaxies) | |
| DOI | https://doi.org/10.1051/0004-6361/201424496 | |
| Published online | 22 July 2015 | |
Online material
Appendix A: Implementation in RECFAST
The recombination equations form a set of three differential equations for the proton fraction xp = np/nH, the singly ionized helium fraction xHeII = nHeII/nH and the matter temperature TM. The electron fraction is then obtained from electric neutrality as xe = xp + xHeII. Following Seager et al. (1999), Seager et al. (2000), and Wong et al. (2008), these are given by 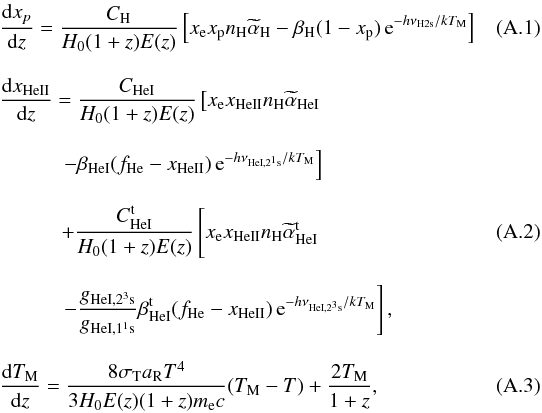 where the second term of Eq. (A.2) accounts for recombination through the triplets, via the semi-forbidden transition 23p → 11s. Here T is the radiation temperature that evolves as T = T0(1 + z).
Equations (A.1)–(A.3) involve quantities that remain constant due to our choice of units, such as the speed of light c, the Planck constant h and the radiation constant aR = 4π2k4/ (6πc3ħ3). They also involve spectroscopic quantities, such as the hydrogen 2s–1s frequency νH2s, and the helium 21p–11s and 23p–11s frequencies, νHeI,21s and νHeI,23s. All these frequencies scale as α2me, as already described in Sect. 2.1. The importance of these rates on the CMB spectrum has been emphasized recently by Mukhanov et al. (2012). The coefficients C are explicitly given by 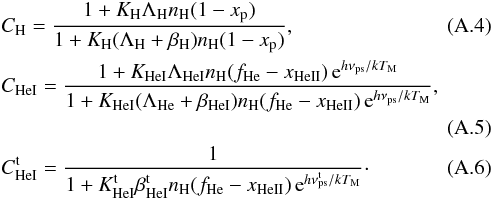 These involve the H 2s–1s and He i 21s–11s two-photon decay rates, ΛH and ΛHeI, which both scale as α8me.
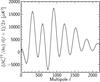 |
Fig. A.1
The quantity |
| Open with DEXTER | |
We also need the case B recombination coefficient for hydrogen (also by unfortunate convention called α), which we label ![]() , and the two recombination coefficients for helium,
, and the two recombination coefficients for helium, ![]() (singlet) and
(singlet) and ![]() (triplet), which are fitted by the same functional form given in Péquignot et al. (1991). These are all assumed to scale as
(triplet), which are fitted by the same functional form given in Péquignot et al. (1991). These are all assumed to scale as ![]() (see footnote 2 for further discussion on this dependence). The photoionization coefficients βH and βHeI are given by
(see footnote 2 for further discussion on this dependence). The photoionization coefficients βH and βHeI are given by ![]() , so that they scale mostly as the recombination coefficients, up to the dependence induced by the frequency in the exponential factor.
, so that they scale mostly as the recombination coefficients, up to the dependence induced by the frequency in the exponential factor.
The “K-quantities”, KH, KHeI and ![]() , are, respectively, the cosmological redshifting of the hydrogen Lyman-α and helium 21p–11s and 23p − 11s transition lines. It can be shown that they scale as
, are, respectively, the cosmological redshifting of the hydrogen Lyman-α and helium 21p–11s and 23p − 11s transition lines. It can be shown that they scale as ![]() .
.
More details on the physical constant dependence of these equations can be found in Kaplinghat et al. (1999), Battye et al. (2001), Scoccola (2009), and Narimani et al. (2012).
Appendix B: How α and me affect the power spectrum
In this Appendix, we illustrate how α and me affect the CMB power spectra through the different terms listed in Sect. 2.1. The dependences described here have already been discussed in earlier papers (Hannestad 1999; Kaplinghat et al. 1999; Battye et al. 2001). However, we are interested in addressing the following two specific questions.
|
Fig. B.1
Left: relative difference between the CMB TT power spectrum calculated using a value of α/α0 different from unity (in one, a few or all the terms where it appears), and a power spectrum, Cℓ,st, calculated using a standard value of α/α0 = 1. We thus plot ΔCℓ/Cℓ = (Cℓ − Cℓ,st) /Cℓ,st[%]. The cases considered are α varying: only in the hydrogen binding energy (solid light blue); only in the Lyα energy (solid yellow); in both the previous two terms (solid purple); in both the previous terms and in the Thomson scattering cross-section (dashed dark blue); in the previous three terms and in the 2 −photon decay rate (dashed red); and in all terms (solid green). In each case, we assume that α varies by + 5% (α/α0 = 1.05) only in the terms considered, while it is α/α0 = 1 in all the others. Right: same as the cases on the left, but for a variation of me of 10% (me/me0 = 1.1). |
|
| Open with DEXTER | |
The first aims to identify the quantities in Sect. 2.1 whose change, due to a variation of the constants, gives the strongest effect on the CMB power spectra.
The second aims to understand what are the dependences that determine the different behaviour of the angular power spectra under a variation of α or me.
In order to investigate these two issues, we perform the following exercise. We add a variation of α (or me) only to one or a few terms at a time, while keeping the value of the constants at the standard values in all other terms. We consider the following cases:
-
1.
variation only in the hydrogen binding energy, as in Eq. (8);
-
2.
variation only in the energy of the “Lyman-α” (Lyα) transition (here improperly defined as the average of the (2s-continuum) and (2p-continuum) energy levels);
-
3.
variation only in the previous two terms together;
-
4.
variation of the previous two terms and the Thomson scattering cross-section σT, as in Eq. (6);
-
5.
variation only in the previous three terms and the 2-photon decay rate Λi, as in Eq. (13);
-
6.
variation of all the terms where the constants appear.
We test the effects on the CMB angular power spectra of the sequence of cases listed above, both for variations of α and me, and show the results in Fig. B.1. There we plot the relative difference between: (i) the angular power spectrum obtained assuming that α (or me) is changing only in a few terms as listed above; and (ii) the standard angular power spectrum, with the constants set to their usual values. For α we assume a variation at the 5% level, while for me we assume a variation at the 10% level. This latter choice is motivated by the fact that atomic energies scale as α2me. Hence changing me by twice the α change should result in similar effects on the angular power spectra, making the comparison between the effects on spectra easier. This is what is shown in Fig. B.1: the blue line (relative to the change of hydrogen binding energy only, item 1 in the list), the yellow line (relative to a change in the Lyα energy level only; item 2) and the purple line (sum of the previous two effects, item 3) are identical for α and for me.
It is evident from the figures that the major contribution to the change in the angular power spectrum induced by a variation of α or me comes from the change in the hydrogen binding energy (item 1) and Lyα energy (item 2). The main effect of changing these two energy levels is to modify the hydrogen 2s–1s transition energy, hνH2s, in Eq. (A.1), since this is, by definition, the difference between the first two mentioned energies. Increasing hνH2s through, e.g., an increase of the hydrogen binding energy, weakens the ionization term in Eq. (A.1) through a decrease of the Boltzmann factor e− hνH2s/kTM, resulting in earlier recombination. As a consequence, acoustic peaks move to higher multipoles, early ISW is increased and the Silk damping is decreased, so that the overall amplitude of the peaks is increased, as already described in Sect. 2.1. On the other hand, increasing the Lyα energy has the opposite effect on hνH2s and would thus tend to delay recombination. However, this effect is mitigated by the other terms where the Lyα energy level appears, such as in the K factors encoding the redshifting of the Lyα photons in Eqs. (12) and (A.4). This is why the effects of increasing both the hydrogen binding energy and the Lyα energy, through an increase of the value of the constants, do not perfectly cancel, but the first effect dominates over the second. Furthermore, as already mentioned, these effects are qualitatively the same for α and for me, although of different magnitude.
A distinction in the effects of α or me is, however, introduced if we now also consider the impact on the Thomson scattering cross-section σT (item 4). As already described in Sect. 2.1, ![]() , i.e., an increase in the value of α increases σT, while an increase in me decreases σT. Consequently, an increase in σT increases Silk damping, while a decrease in σT decreases Silk damping. This is the reason why adding the effect of the constants on the Thomson cross-section, shown in the dark-blue dashed lines in Fig. B.1, increases the amplitude of the peaks for a larger value of α, while it decreases it for a larger value of me. Consequently, this is the reason why α and me have different effects on the amplitude of the peaks.
, i.e., an increase in the value of α increases σT, while an increase in me decreases σT. Consequently, an increase in σT increases Silk damping, while a decrease in σT decreases Silk damping. This is the reason why adding the effect of the constants on the Thomson cross-section, shown in the dark-blue dashed lines in Fig. B.1, increases the amplitude of the peaks for a larger value of α, while it decreases it for a larger value of me. Consequently, this is the reason why α and me have different effects on the amplitude of the peaks.
We now analyse the effect of adding the variation of constants in the 2-photon decay rate (item 5). As shown in Eq. (13), this ratio depends much more strongly on α than on me, Λ ∝ α8me. The effect of increasing the value of the constants in this term is again to shift recombination to earlier times, but, as expected, the impact is much larger when varying α than when varying me, as shown by the dashed red line in Fig. B.1. Finally, adding the variation of the constants in all the remaining terms, including the equations for helium recombination, further adjusts the amplitudes at the few percent level, to finally converge to the green solid line. In particular, we verified that neglecting the effects of the variation of the constants on helium recombination impacts the constraints by less than 5%.
For the sake of completeness, we show in Fig. B.2 the effect of varying the constants on the EE-polarization. The effects are similar to the ones described for temperature, although changes are in this case even larger. High accuracy observations of the polarization power spectra might therefore help in improving the constraints on fundamental constants.
|
Fig. B.2
Same as Fig. B.1, but for EE polarization power spectra. |
|
| Open with DEXTER | |
Appendix C: Additional tables and figures
In this Appendix, we collect some of the tables and figures already extensively described in the paper. We show the constraints on cosmological parameters for a ΛCDM+ α + Neff model in Table C.1, a ΛCDM+ α + Yp model in Table C.2, a ΛCDM+ α removing the low-ℓ data in Table C.3, and for a ΛCDM+me model removing the low-ℓ data in Table C.4. Furthermore, Fig. C.1 shows the two-dimensional contour plots between α and foreground parameters, while Fig. C.2 shows the same for me.
Constraints on the cosmological parameters for the base ΛCDM model with the addition of a varying fine structure constant and number of relativistic species, Neff.
Constraints on the cosmological parameters for the base ΛCDM model with the addition of a varying fine structure constant and helium abundance, Yp.
Constraints on the cosmological parameters for the base ΛCDM model with the addition of a varying fine structure constant for Planck data, removing the low-ℓ multipoles and placing a Gaussian prior on τ.
Constraints on the cosmological parameters for the base ΛCDM model with the addition of the mass of the electron for Planck data, removing the low-ℓ multipoles and placing a Gaussian prior on τ.
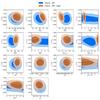 |
Fig. C.1
Two-dimensional likelihood contours (68% and 95%) for α/α0 versus different foreground/beam/calibration parameters, as defined in Table 4 of Planck Collaboration XVI (2014). We show results for Planck+WP (blue) and Planck+WP+highL (orange) data combinations. |
| Open with DEXTER | |
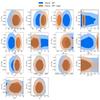 |
Fig. C.2
Two-dimensional likelihood contours (68% and 95%) for me/me0 versus different foreground/beam/calibration parameters, as defined in Table 4 in Planck Collaboration XVI (2014). We show results for Planck+WP (blue) and Planck+WP+highL (orange) data combinations. |
| Open with DEXTER | |
© ESO, 2015
Current usage metrics show cumulative count of Article Views (full-text article views including HTML views, PDF and ePub downloads, according to the available data) and Abstracts Views on Vision4Press platform.
Data correspond to usage on the plateform after 2015. The current usage metrics is available 48-96 hours after online publication and is updated daily on week days.
Initial download of the metrics may take a while.