| Issue |
A&A
Volume 579, July 2015
|
|
|---|---|---|
| Article Number | A66 | |
| Number of page(s) | 22 | |
| Section | Stellar structure and evolution | |
| DOI | https://doi.org/10.1051/0004-6361/201526169 | |
| Published online | 29 June 2015 | |
Online material
Appendix A: Comments on individual objects
Here we report the previous results available in the literature in Table A.1. These are discussed in Sect. 3.3 in comparison with our estimates. In the following, we discuss some peculiar objects in the sample.
Appendix A.1: ISO−Oph094
The location of this object on the HRD that we derive is that of a very old PMS object, much older than 100 Myr. However, the spectrum of this object has S/N ~ 0 in the whole VIS arm and also has low S/N in the NIR arm. The SpT we have derived is compatible with the highly uncertain estimates by Alves de Oliveira et al. (2012), who suggest that this object has probably a SpT earlier than M3 and strongly extincted (AV = 20.1 mag). Also, their NIR spectra had very low S/N and their estimates are tentative. Even if we allow for higher values of AV in our fit, we obtain the same best fit as that we report in this manuscript. As there is no other information available in the literature for these targets from mid-infrared data other than Bontemps et al. (2001), we are not able to further constrain its evolutionary class, which was reported to be Class II using ISO photometry. With the spectra available and the information in our hand, we cannot further constrain the properties of this object. Our classification for this object as subluminous is also related to the tentative detection of forbidden emission lines in its spectrum. However, given the very low S/N of the continuum of this object, the subtraction of sky lines is not trivial and residuals are present even after careful extraction of the spectrum.
Appendix A.2: ISO−Oph102
The value of ![]() for the best fit for this object is ~12.4. As discussed in Sect. 2, the spectrum of this target is of very poor quality in the last ~100 nm of the VIS arm. We have therefore neglected some points in this region to avoid biases due to the poor quality of the spectrum. Even if the value of
for the best fit for this object is ~12.4. As discussed in Sect. 2, the spectrum of this target is of very poor quality in the last ~100 nm of the VIS arm. We have therefore neglected some points in this region to avoid biases due to the poor quality of the spectrum. Even if the value of ![]() is high, the best-fit template reproduces correctly the spectrum in the other features at shorter wavelength and in the NIR. Finally, our estimates are in good agreement with the literature.
is high, the best-fit template reproduces correctly the spectrum in the other features at shorter wavelength and in the NIR. Finally, our estimates are in good agreement with the literature.
Appendix A.3: ISO−Oph123
As we mentioned many times, this object is very peculiar and the analysis of its spectrum does not lead to a satisfying estimate of its stellar properties. This object has been studied by Wilking et al. (2005) who reported a SpT of M3.5 with no particular comments, only that there were strong emission lines in the spectrum. Scholz (2012) has also noted that this object is extremely variable in the near infrared, with variations up to ~0.9 mag in K-band. The flux calibration of the spectrum analyzed here is compatible with the 2MASS photometry in J- and H-bands, and it was only correct by a factor 1.12 to account for slit losses to match these bands. The magnitudes at optical wavelengths reported in the literature are, instead, slightly lower than the observed flux of this spectrum. The procedure adopted here for the rest of the targets does not result in a low value of ![]() for this target. The best-fit estimate is also probably uncertain as this object seems a very strong accretor, and we discussed that our procedure fails if the target has Lacc/L⋆≳0.5, as could be the case for this object. As the excess due to accretion could significantly change the shape of the continuum, it is not possible to determine the real reddening of the spectrum without considering all the components, such as excess due to accretion or reddening. We tried to fit this spectrum using the procedure by Manara et al. (2013b), as the S/N in the UVB arm, although very low, is not zero. However, this automatic procedure is not able to reproduce the spectrum in the Balmer continuum region without further constraints on some parameters of the fit. We have then constrained the value of AV to be between ~5 mag and ~7 mag, as this is the range of values for which the spread of Lacc derived from the various emission lines present in the spectrum is minimum. With this constraint and forcing L⋆ for this object to be that of a 1.2 or 2 Myr old YSO, we obtain a best fit with SpT M5. The accretion rates that would result from the fit of the UV-excess with these parameters are one order of magnitude higher than those derived from the emission lines, however, and would result in a VLMS (M⋆= 0.17 M⊙) accreting at Ṁacc ~ 8 × 10⁻⁷M⊙/yr. As we show in Fig. C.1, many emission lines in this spectrum show strong absorption features in their profiles, and this could suggest that their real flux is larger. We do not expect the difference with the real flux to be larger than a factor ~2−3, which still is not compatible with the estimates from the UV-excess fit. The profiles of these lines suggest that this object might have a powerful jet, but more analyses are needed and are out of the scope of this work.
for this target. The best-fit estimate is also probably uncertain as this object seems a very strong accretor, and we discussed that our procedure fails if the target has Lacc/L⋆≳0.5, as could be the case for this object. As the excess due to accretion could significantly change the shape of the continuum, it is not possible to determine the real reddening of the spectrum without considering all the components, such as excess due to accretion or reddening. We tried to fit this spectrum using the procedure by Manara et al. (2013b), as the S/N in the UVB arm, although very low, is not zero. However, this automatic procedure is not able to reproduce the spectrum in the Balmer continuum region without further constraints on some parameters of the fit. We have then constrained the value of AV to be between ~5 mag and ~7 mag, as this is the range of values for which the spread of Lacc derived from the various emission lines present in the spectrum is minimum. With this constraint and forcing L⋆ for this object to be that of a 1.2 or 2 Myr old YSO, we obtain a best fit with SpT M5. The accretion rates that would result from the fit of the UV-excess with these parameters are one order of magnitude higher than those derived from the emission lines, however, and would result in a VLMS (M⋆= 0.17 M⊙) accreting at Ṁacc ~ 8 × 10⁻⁷M⊙/yr. As we show in Fig. C.1, many emission lines in this spectrum show strong absorption features in their profiles, and this could suggest that their real flux is larger. We do not expect the difference with the real flux to be larger than a factor ~2−3, which still is not compatible with the estimates from the UV-excess fit. The profiles of these lines suggest that this object might have a powerful jet, but more analyses are needed and are out of the scope of this work.
Appendix A.4: ISO−Oph165
As reported by McClure et al. (2010), this target is a Class I object. Therefore, its photospheric continuum is strongly extincted by the envelope that still surrounds the central star and the estimates of L⋆ are biased by this. This is the reason why this object appears to be subluminous on the HRD.
Data available in the literature for the targets included in this work.
Appendix B: Best fit of observed ρ-Oph spectra with templates
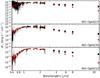 |
Fig. B.1
Spectra of ρ-Oph targets from 600 to 2450 nm and Spitzer photometry up to 24 μm. The extinction-corrected spectra and photometric points corrected for extinction following McClure (2009) are shown in black. Red lines and points are used for the best-fit template spectrum, which is normalized at λ = 1025 nm to match the extinction-corrected target spectrum. Veiling due to accretion or disk emission is not included. |
| Open with DEXTER | |
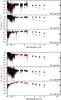 |
Fig. B.1
continued. |
| Open with DEXTER | |
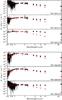 |
Fig. B.1
continued. |
| Open with DEXTER | |
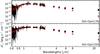 |
Fig. B.1
continued. |
| Open with DEXTER | |
Appendix C: Permitted emission line profiles in the X-Shooter spectra
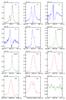 |
Fig. C.1
Line profiles of permitted transition lines of ISO–Oph123. |
| Open with DEXTER | |
Extinction-corrected fluxes and equivalent widths of Balmer, Paschen, and Bracket lines.
Extinction-corrected fluxes and equivalent widths of helium and calcium lines.
Appendix D: Stellar and accretion parameters by Natta et al. (2006) corrected for the most recent distanceestimate
© ESO, 2015
Current usage metrics show cumulative count of Article Views (full-text article views including HTML views, PDF and ePub downloads, according to the available data) and Abstracts Views on Vision4Press platform.
Data correspond to usage on the plateform after 2015. The current usage metrics is available 48-96 hours after online publication and is updated daily on week days.
Initial download of the metrics may take a while.