| Issue |
A&A
Volume 578, June 2015
|
|
|---|---|---|
| Article Number | A76 | |
| Number of page(s) | 11 | |
| Section | Stellar structure and evolution | |
| DOI | https://doi.org/10.1051/0004-6361/201525922 | |
| Published online | 09 June 2015 | |
Online material
Appendix A: Results for the fitting the acoustic signatures
All the individual angular frequency measurements and corresponding second differences of the radial modes are listed in the Tables A.1. The results for the first differences ![]() and second differences
and second differences ![]() of all the LRGs are shown in the Figs. A.1 to A.17, similar to those provided for KIC 12008916 in Fig. 1.
of all the LRGs are shown in the Figs. A.1 to A.17, similar to those provided for KIC 12008916 in Fig. 1.
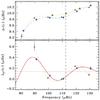 |
Fig. A.1
Same description as in Fig. 1 but for KIC 3744043, with yellow star from ℓ = 3 modes and corresponding polynomial fit with same color. |
| Open with DEXTER | |
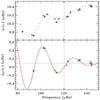 |
Fig. A.2
Same description as in Fig. 1 but for KIC 6117517, with yellow star from ℓ = 3 modes and corresponding polynomial fit with same color. Open symbols represent measurements that used modes with detection probability under the threshold suggested by C15. |
| Open with DEXTER | |
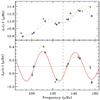 |
Fig. A.3
Same description as in Fig. 1 but for KIC 6144777, with yellow star from ℓ = 3 modes and corresponding polynomial fit with same color. |
| Open with DEXTER | |
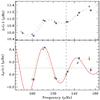 |
Fig. A.4
Same description as in Fig. 1 but for KIC 7060732. |
| Open with DEXTER | |
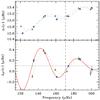 |
Fig. A.5
Same description as in Fig. 1 but for KIC 7619745. |
| Open with DEXTER | |
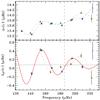 |
Fig. A.6
Same description as in Fig. 1 but for KIC 8366239. Open symbols represent measurements that used modes with detection probability under the threshold suggested by C15. |
| Open with DEXTER | |
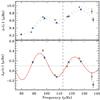 |
Fig. A.7
Same description as in Fig. 1 but for KIC 8475025. |
| Open with DEXTER | |
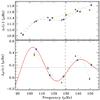 |
Fig. A.8
Same description as in Fig. 1 but for KIC 8718745, with yellow star from ℓ = 3 modes and corresponding polynomial fit with same color. |
| Open with DEXTER | |
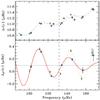 |
Fig. A.9
Same description as in Fig. 1 but for KIC 9145955, with yellow star from ℓ = 3 modes and corresponding polynomial fit with same color. Open symbols represent measurements that used modes with detection probability under the threshold suggested by C15. |
| Open with DEXTER | |
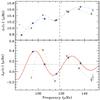 |
Fig. A.10
Same description as in Fig. 1 but for KIC 9267654. Open symbols represent measurements that used modes with detection probability under the threshold suggested by C15. |
| Open with DEXTER | |
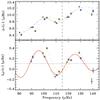 |
Fig. A.11
Same description as in Fig. 1 but for KIC 9475697, with yellow star from ℓ = 3 modes and corresponding polynomial fit with same color. Open symbols represent measurements that used modes with detection probability under the threshold suggested by C15. |
| Open with DEXTER | |
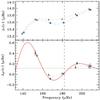 |
Fig. A.12
Same description as in Fig. 1 but for KIC 9882316. |
| Open with DEXTER | |
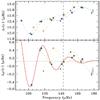 |
Fig. A.13
Same description as in Fig. 1 but for KIC 10200377, with yellow star from ℓ = 3 modes and corresponding polynomial fit with same color. Open symbols represent measurements that used modes with detection probability under the threshold suggested by C15. |
| Open with DEXTER | |
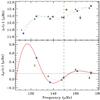 |
Fig. A.14
Same description as in Fig. 1 but for KIC 10257278, with yellow star from ℓ = 3 modes and corresponding polynomial fit with same color. Open symbols represent measurements that used modes with detection probability under the threshold suggested by C15. |
| Open with DEXTER | |
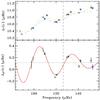 |
Fig. A.15
Same description as in Fig. 1 but for KIC 11353313, with yellow star from ℓ = 3 modes and corresponding polynomial fit with same color. Open symbols represent measurements that used modes with detection probability under the threshold suggested by C15. |
| Open with DEXTER | |
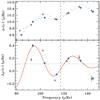 |
Fig. A.16
Same description as in Fig. 1 but for KIC 11913545. |
| Open with DEXTER | |
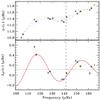 |
Fig. A.17
Same description as in Fig. 1 but for KIC 11968334, with yellow star from ℓ = 3 modes and corresponding polynomial fit with same color. Open symbols represent measurements that used modes with detection probability under the threshold suggested by C15. |
| Open with DEXTER | |
Radial angular frequencies ωn,0 and second angular frequency differences Δ2ωn,0 for all the stars of the sample.
© ESO, 2015
Current usage metrics show cumulative count of Article Views (full-text article views including HTML views, PDF and ePub downloads, according to the available data) and Abstracts Views on Vision4Press platform.
Data correspond to usage on the plateform after 2015. The current usage metrics is available 48-96 hours after online publication and is updated daily on week days.
Initial download of the metrics may take a while.