| Issue |
A&A
Volume 578, June 2015
|
|
|---|---|---|
| Article Number | A48 | |
| Number of page(s) | 19 | |
| Section | Extragalactic astronomy | |
| DOI | https://doi.org/10.1051/0004-6361/201425567 | |
| Published online | 02 June 2015 | |
Online material
Appendix A
The appendix presents in graphical form (Figs. A.1 to A.6), the emission line maps and distribution of the emission line ratios in the log(FeII]1.64 μm/Brγ) − log(H22.12 μm/Brγ) plane for the sample of LIRGs, excluding the prototypes that have already been discussed (Figs. 2 to 4). Notes on individual galaxies can be found elsewhere (Piqueras López et al. 2012).
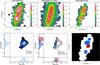 |
Fig. A.1
Emission line maps and near-IR diagnostic planes for NGC 2369. Colour-coded symbols as in Fig. 2. |
| Open with DEXTER | |
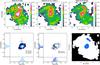 |
Fig. A.2
Emission line maps and near-IR diagnostic planes for NGC 3110. Colour-coded symbols as in Fig. 2. |
| Open with DEXTER | |
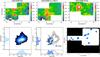 |
Fig. A.3
Emission line maps and near-IR diagnostic planes for NGC 3256. Colour-coded symbols as in Fig. 2. |
| Open with DEXTER | |
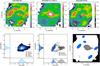 |
Fig. A.4
Emission line maps and near-IR diagnostic planes for ESO320−G030. Colour-coded symbols as in Fig. 2. |
| Open with DEXTER | |
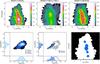 |
Fig. A.5
Emission line maps and near-IR diagnostic planes for IRASF 17138−1017. Colour-coded symbols as in Fig. 2. |
| Open with DEXTER | |
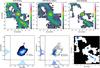 |
Fig. A.6
Emission line maps and near-IR diagnostic planes for IC 5179. Colour-coded symbols as in Fig. 2. |
| Open with DEXTER | |
© ESO, 2015
Current usage metrics show cumulative count of Article Views (full-text article views including HTML views, PDF and ePub downloads, according to the available data) and Abstracts Views on Vision4Press platform.
Data correspond to usage on the plateform after 2015. The current usage metrics is available 48-96 hours after online publication and is updated daily on week days.
Initial download of the metrics may take a while.