| Issue |
A&A
Volume 578, June 2015
|
|
|---|---|---|
| Article Number | A83 | |
| Number of page(s) | 14 | |
| Section | Cosmology (including clusters of galaxies) | |
| DOI | https://doi.org/10.1051/0004-6361/201425334 | |
| Published online | 10 June 2015 | |
Online material
Appendix A: Spectral energy distributions and redshift probability distribution functions
In this section we show the spectral energy distributions (SEDs) and the probability distribution functions (PDFs) of the photometric redshift estimates for each AGN candidate derived from the Dahlen el al. (2013) analysis. Most of the candidates in Fig. A.1 show PDFs confined at z> 4 with only small wings at z< 4. The most uncertain redshifts are for the objects 20 765, 28 476, 29 323, and 33 160, although the larger PDFs distributions are mostly distributed at z> 4. We note that the last three objects at z> 6 are among the most uncertain owing to the combination of the power-law shape of their SEDs and the faintness of the sources. We also note that for some of these objects, the Bayesian photometric redshift does not correspond to the peak of the PDF, but is the result of a weighted average around the maximum.
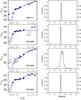 |
Fig. A.1
Spectral energy distributions and probability distribution functions of photometric redshifts normalized to 1 at the peak for all the AGN candidates shown in Table 2. 1σ upper limits are shown as downward arrows. |
| Open with DEXTER | |
|
Fig. A.1
continued. |
|
| Open with DEXTER | |
|
Fig. A.1
continued. |
|
| Open with DEXTER | |
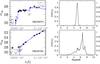 |
Fig. A.1
continued. |
| Open with DEXTER | |
Appendix B: X-ray position accuracy
In this section we show an example of the relative position accuracy between the X-ray and H band image. We have selected the object 28476 already shown in Fig. 1 which is located near two brighter H band sources. In Fig. B.1 we also show the position accuracy of a bright source in the bottom left corner, comparable to that of 28476. In general the position accuracy between the H and X-ray sources is ≲1 arcsec for all the AGN candidates in our sample. They have off-axis Chandra positions <9 arcmin.
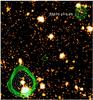 |
Fig. B.1
H band image around the AGN candidate 28 476 (upper right) shown in Fig. 1. The size is 30 arcsec. Cyan and green contours are X-ray detections in the 0.8−4 keV and 0.5−2 keV bands, respectively. Position accuracies are within 1 arcsec. |
| Open with DEXTER | |
© ESO, 2015
Current usage metrics show cumulative count of Article Views (full-text article views including HTML views, PDF and ePub downloads, according to the available data) and Abstracts Views on Vision4Press platform.
Data correspond to usage on the plateform after 2015. The current usage metrics is available 48-96 hours after online publication and is updated daily on week days.
Initial download of the metrics may take a while.