| Issue |
A&A
Volume 578, June 2015
|
|
|---|---|---|
| Article Number | A108 | |
| Number of page(s) | 16 | |
| Section | Interstellar and circumstellar matter | |
| DOI | https://doi.org/10.1051/0004-6361/201425090 | |
| Published online | 12 June 2015 | |
Online material
Appendix A: Tests of the dust model
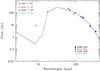 |
Fig. A.1
Fits of the far-infrared (λ> 20 μm) SED of the nebula around AG Car. The dust composition (optical constants of silicates with a 50/50 Mg-to-Fe abundance given by Dorschner et al. 1995) and acen are kept constant while the value of amax changes. |
| Open with DEXTER | |
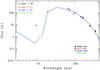 |
Fig. A.2
Fits of the far-infrared (λ> 20 μm) SED of the nebula around AG Car. The dust composition (optical constants of silicates with a 50/50 Mg-to-Fe abundance given by Dorschner et al. 1995) and amax are kept constant while the value of acen changes. |
| Open with DEXTER | |
In Sect. 4 the model of the dust nebula is presented and the necessity of a population of large dust grains is stressed. Several tests have been performed using the 2-Dust code in an effort to reproduce the observed data with different populations of dust grains from those adopted in Sect. 4. Our main concern was to investigate the influence of the dust grain size and composition on the model SED. For this reason, we calculated many models by changing one parameter and keeping the other ones constant. Keeping in mind that two different populations of grains were used to reproduce the broad observed SED in Sect. 4, we consider one population of small grains with radii amin<a<acen and one population of large grains with radii acen<a<amax. For the dust composition, we used the optical constants given by Dorschner et al. (1995) for three different abundances of Mg to Fe, 0.5/0.5 (the model presented in Sect. 4), 0.4/0.6, and 0.8/0.2. For the dust grain sizes, the values of 20, 50, and 80 μm were considered for amax and the values of 0.1, 0.3, 1, and 3 μm were considered for acen, with the value of amin being kept constant and equal to 0.005 μm.
The comparison of these tests shows that large grains are necessary to reproduce the data. The influence of the change of acen on the fit of the observed SED is almost negligible. Furthermore, the fit depends little on the dust abundance of Mg to Fe. This is illustrated in Figs. A.1–A.3. In Fig. A.1 three dust models are illustrated. The dust composition is the same (optical constants of silicates with a 50/50 Mg-to-Fe abundance given by Dorschner et al. 1995) and the only parameter that changes is amax. We see that better fits to the data are achieved when large grains are considered, in particular when amax = 50 μm. In all cases, when adjusting the observed flux at 250 μm, a value for amax that is too small (<20 μm) gives too much flux at 60−100 μm. In Fig. A.2 the comparison of three models with the same amax and dust composition but with different acen is illustrated. The model SED depends little on acen. In Fig. A.3 the comparison of three models with the same grain sizes but different dust composition (in terms of the abundance Mg to Fe) is illustrated. Again, the model SED depends little on this dust abundance ratio, with a slightly better adjustment for Mg/Fe = 50/50. We finally note that changing the power law index of the grain size distribution does not significantly affect these results.
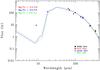 |
Fig. A.3
Fits of the far-infrared (λ> 20μm) SED of the nebula around AG Car. amax = 50μm and acen = 1μm are kept constant while the dust composition changes. The optical constants of silicates given by Dorschner et al. (1995) are used for different Mg-to-Fe abundances. |
| Open with DEXTER | |
Appendix B: Modified blackbody fit on the SED
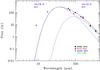 |
Fig. B.1
Same as Fig. 5 but the infrared SED of the nebula around the LBV AG Car is fitted by the sum of two modified blackbody curves. |
| Open with DEXTER | |
The observed SED (Fig. 5) can also be reproduced with a simpler model that is the sum of two modified BB curves Fν ∝ Bν(Td)νβ. Only the photometric points were considered for making the fit illustrated in Fig. B.1. The mass of the dust can then be derived using the equation  (B.1)where κν is the mass absorption coefficient, i.e. the absorption cross section per unit mass, Bν the Planck function and D the distance to the nebula (Hildebrand 1983). For this calculation, the two populations of dust grains are considered independently. The fluxes measured at 25 μm and 250 μm are used, i.e., at those wavelengths where the contribution of each population dominates (Fig. B.1). At 25 μm, κν = 483 cm2 g-1 for the silicates of Dorschner et al. (1995). For grains of radii smaller than the wavelengths at which dust radiates, κν is roughly independent of the radius and behaves as νβ in the far-infrared. However the second population of dust grains involves large grains (up to 50 μm) so that this hypothesis is no longer valid. The value of κν is then taken from the 2-Dust results where it is explicitly
computed for the adopted grain population. At 250 μm, κν = 13.6 cm2 g-1, which is significantly higher than expected under the small-grain approximation. With such large grains the frequency dependence of κν also differs from the ν2 law, being closer to ν1 below 100 μm. A fit with such a composite modified BB gives Tdust,1 = 76 K and Tdust,2 = 31 K (which is only slightly different from the values obtained with ν2 only). Using Tdust,1 = 76−78 K and Tdust,2 = 31−33 K in Eq. (B.1), we then derive Mdust,1 = 0.05−0.04M⊙ and Mdust,2 = 0.22−0.19 M⊙ for the small and the large grains respectively, in very good agreement with the 2-Dust results.
Appendix C: Emission line fluxes for each spaxel
The results of the emission line flux measurements for each spaxel are given in Table C.1. The first column contains the detected ions along with the spectral band in which the corresponding line was measured. The following columns contain the line fluxes, expressed in W/m2, along with their errors. The spaxel numbers (Fig. 6) are mentioned in every cell of the table. The quoted uncertainties are the sum of the line-fitting uncertainty plus the uncertainty due to the position of the continuum.
Line fluxes in each spaxel.
© ESO, 2015
Current usage metrics show cumulative count of Article Views (full-text article views including HTML views, PDF and ePub downloads, according to the available data) and Abstracts Views on Vision4Press platform.
Data correspond to usage on the plateform after 2015. The current usage metrics is available 48-96 hours after online publication and is updated daily on week days.
Initial download of the metrics may take a while.