| Issue |
A&A
Volume 577, May 2015
|
|
|---|---|---|
| Article Number | A9 | |
| Number of page(s) | 18 | |
| Section | Galactic structure, stellar clusters and populations | |
| DOI | https://doi.org/10.1051/0004-6361/201425327 | |
| Published online | 22 April 2015 | |
Online material
Appendix A: Line lists
Line lists for the synthesis of Sc ii.
Line lists for synthesis of the V i lines.
Line lists for synthesis of the Mn i lines.
Line lists for synthesis of the Co i lines.
Appendix B: Solar abundance plots
In Figs. B.1−B.3 the synthesis for all the lines analyzed in this work for the solar spectrum from Vesta observed at Magellan in January 2006 is shown. Each plot shows (in the bigger panel) the line fitting with the best fit to the observed one and the different abundances in steps of 0.04 dex. In the lower panel the differences between the observed spectrum and the synthetic one are shown, with the difference with the best fit highlighted. In the small square panel the χ2 values for the different abundances are represented, with the red dot representing the minimum and therefore the best fit value for the elemental abundance.
 |
Fig. B.1
Solar spectrum taken using asteroid Vesta during run at Magellan in January 2006. Spectral lines are listed in order of element and wavelength. Chemical elements with all the hfs lines are indicated inside the lines. The different colored lines are the different synthetic spectra with different abundances in steps of 0.04 dex, while the dots are the observed spectra. In the lower panels are the values of differences between the real and synthetic spectra for the synthetic spectra plotted above. The red lines represent the best fit derived from unnormalized χ2, visible in the small plot as a red dot. Here the fits for the five Sc lines are shown. |
| Open with DEXTER | |
 |
Fig. B.2
As in Fig. B.1 but for the five V lines. |
| Open with DEXTER | |
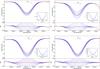 |
Fig. B.3
As in Fig. B.1 but for the four Mn lines. |
| Open with DEXTER | |
 |
Fig. B.4
As in Fig. B.1 but for the four Co lines. |
| Open with DEXTER | |
© ESO, 2015
Current usage metrics show cumulative count of Article Views (full-text article views including HTML views, PDF and ePub downloads, according to the available data) and Abstracts Views on Vision4Press platform.
Data correspond to usage on the plateform after 2015. The current usage metrics is available 48-96 hours after online publication and is updated daily on week days.
Initial download of the metrics may take a while.