| Issue |
A&A
Volume 575, March 2015
|
|
|---|---|---|
| Article Number | A69 | |
| Number of page(s) | 10 | |
| Section | Cosmology (including clusters of galaxies) | |
| DOI | https://doi.org/10.1051/0004-6361/201425159 | |
| Published online | 25 February 2015 | |
Online material
Appendix A: DEIMOS/GMOS redshift comparison
We show in Fig. A.1 the difference between the GEMINI/GMOS redshifts and the KECK/DEIMOS DEEP2 redshifts as a function of redshift.
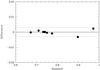 |
Fig. A.1
Comparison of Deep2 Keck/DEIMOS and GMOS/Gemini redshifts. The solid horizontal line symbolises the perfect agreement. The two dashed lines represent the 3σ maximum uncertainty between the two redshift measurements taking the resolution of the GMOS grism and the smoothing of the spectra into account. |
| Open with DEXTER | |
Appendix B: Examples of spectra
Below are four examples of spectra corresponding to flags 4, 3, and 2 in Figs. B.1 and B.2.
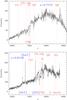 |
Fig. B.1
Two examples of Gemini/GMOS spectra with flags 4. Red labelled lines show absorption lines and blue labelled lines show emission lines. |
| Open with DEXTER | |
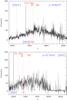 |
Fig. B.2
Two examples of Gemini/GMOS spectra with flags 3 and 2. Red labelled lines show absorption lines and blue labelled lines show emission lines. From top to bottom: one spectrum with flag 3 and one spectrum with flag 2. |
| Open with DEXTER | |
© ESO, 2015
Current usage metrics show cumulative count of Article Views (full-text article views including HTML views, PDF and ePub downloads, according to the available data) and Abstracts Views on Vision4Press platform.
Data correspond to usage on the plateform after 2015. The current usage metrics is available 48-96 hours after online publication and is updated daily on week days.
Initial download of the metrics may take a while.