| Issue |
A&A
Volume 575, March 2015
|
|
|---|---|---|
| Article Number | A13 | |
| Number of page(s) | 33 | |
| Section | Extragalactic astronomy | |
| DOI | https://doi.org/10.1051/0004-6361/201424972 | |
| Published online | 11 February 2015 | |
Online material
Gamma-ray spectral characteristics.
X-ray characteristics.
Swift/UVOT observed average magnitudes (extracted from all the data integrated).
Characteristics at radio frequencies (VLBI).
Spectral indices (Sν ∝ ν− α) at different frequencies.
Shortest variability at optical-to-γ ray frequencies.
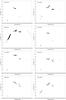 |
Fig. 8
Spectral energy distributions of the sources in the present sample. Data are corrected for the Galactic absorption. Points refer to detections; arrows are upper limits; the continuous lines are the optical spectra. |
| Open with DEXTER | |
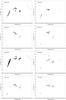 |
Fig. 9
Spectral energy distributions of the sources in the present sample. Data are corrected for the Galactic absorption. Points refer to detections; arrows are upper limits; the continuous lines are the optical spectra. |
| Open with DEXTER | |
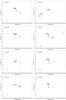 |
Fig. 10
Spectral energy distributions of the sources in the present sample. Data are corrected for the Galactic absorption. Points refer to detections; arrows are upper limits; the continuous lines are the optical spectra. |
| Open with DEXTER | |
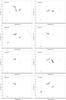 |
Fig. 11
Spectral energy distributions of the sources in the present sample. Data are corrected for the Galactic absorption. Points refer to detections; arrows are upper limits; the continuous lines are the optical spectra. |
| Open with DEXTER | |
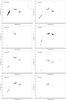 |
Fig. 12
Spectral energy distributions of the sources in the present sample. Data are corrected for the Galactic absorption. Points refer to detections; arrows are upper limits; the continuous lines are the optical spectra. |
| Open with DEXTER | |
|
Fig. 13
Spectral energy distributions of the sources in the present sample. Data are corrected for the Galactic absorption. Points refer to detections; arrows are upper limits; the continuous lines are the optical spectra. |
|
| Open with DEXTER | |
© ESO, 2015
Current usage metrics show cumulative count of Article Views (full-text article views including HTML views, PDF and ePub downloads, according to the available data) and Abstracts Views on Vision4Press platform.
Data correspond to usage on the plateform after 2015. The current usage metrics is available 48-96 hours after online publication and is updated daily on week days.
Initial download of the metrics may take a while.