| Issue |
A&A
Volume 574, February 2015
|
|
|---|---|---|
| Article Number | A25 | |
| Number of page(s) | 18 | |
| Section | Stellar atmospheres | |
| DOI | https://doi.org/10.1051/0004-6361/201424229 | |
| Published online | 19 January 2015 | |
Online material
Spectroscopic observations of AF Lep with SES at the STELLA observatory.
Spectroscopic observations of AF Lep with SemelPol at the AAT.
Spectroscopic observations of AF Lep with SOFIN at the Nordic Optical Telescope.
|
Fig. 7
Calculated (red line) and observed (black line) spectral lines for 2005.87 data set using Fe i 6411.64 Å line. |
|
| Open with DEXTER | |
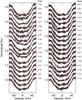 |
Fig. 8
Calculated (red line) and observed (black line) LSD profiles for 2008.95 data set. |
| Open with DEXTER | |
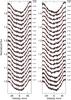 |
Fig. 9
Calculated (red line) and observed (black line) LSD profiles for 2009.92 data set. |
| Open with DEXTER | |
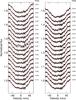 |
Fig. 10
Calculated (red line) and observed (black line) LSD profiles for 2010.04 data set. |
| Open with DEXTER | |
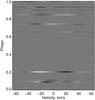 |
Fig. 11
Difference between the mean profile and the observed profile for 2005 data to show the movements of the spots through line profiles as a function of phase. The darker colour indicates the presence of a spot. |
| Open with DEXTER | |
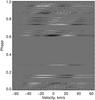 |
Fig. 12
As Fig. 11 but for 2008 data. |
| Open with DEXTER | |
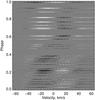 |
Fig. 13
As Fig. 11 but for 2009 data. |
| Open with DEXTER | |
 |
Fig. 14
As Fig. 11 but for 2010 data. |
| Open with DEXTER | |
© ESO, 2015
Current usage metrics show cumulative count of Article Views (full-text article views including HTML views, PDF and ePub downloads, according to the available data) and Abstracts Views on Vision4Press platform.
Data correspond to usage on the plateform after 2015. The current usage metrics is available 48-96 hours after online publication and is updated daily on week days.
Initial download of the metrics may take a while.