| Issue |
A&A
Volume 574, February 2015
|
|
|---|---|---|
| Article Number | A139 | |
| Number of page(s) | 13 | |
| Section | Interstellar and circumstellar matter | |
| DOI | https://doi.org/10.1051/0004-6361/201321516 | |
| Published online | 09 February 2015 | |
Online material
Appendix A: Map of CO 3–2 emission
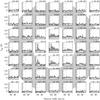 |
Fig. A.1
Map of the APEX CO 3−2 emission (velocity resolution 2 km s-1) around IRAS 17163, with the star at (0, 0). The grey background ring shows the location and extent of the 25″ dust ring. Most of the CO emission is found inside this dust ring. Note also the dashed red lines that mark 70 km s-1, dividing the blue and red components of the emission profile. These components are spatially separated, with the blue component peaking around (10″, 0) and the red component around (–10″, 0). |
| Open with DEXTER | |
Appendix B: Optical spectrum of IRAS 17163, overlaid with the spectrum of IRC+10420
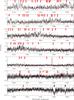 |
Fig. B.1
Optical spectrum of IRAS 17163, in black, overlaid with the spectrum of IRC+10420 (from Oudmaijer 1998), in red. The line identifications in red were made for the IRC+10420 spectrum by Oudmaijer (1998; with UN indicating an unidentified line, and H hydrogen recombination lines), and have been corrected for a systemic velocity of 75 km s-1. The Fe II identifications in black have been corrected for a line velocity of 18 km s-1. |
| Open with DEXTER | |
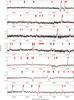 |
Fig. B.1
continued. |
| Open with DEXTER | |
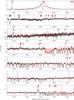 |
Fig. B.1
continued. |
| Open with DEXTER | |
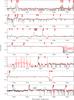 |
Fig. B.1
continued. |
| Open with DEXTER | |
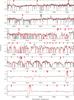 |
Fig. B.1
continued. |
| Open with DEXTER | |
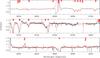 |
Fig. B.1
continued. |
| Open with DEXTER | |
© ESO, 2015
Current usage metrics show cumulative count of Article Views (full-text article views including HTML views, PDF and ePub downloads, according to the available data) and Abstracts Views on Vision4Press platform.
Data correspond to usage on the plateform after 2015. The current usage metrics is available 48-96 hours after online publication and is updated daily on week days.
Initial download of the metrics may take a while.