| Issue |
A&A
Volume 573, January 2015
|
|
|---|---|---|
| Article Number | A125 | |
| Number of page(s) | 18 | |
| Section | Extragalactic astronomy | |
| DOI | https://doi.org/10.1051/0004-6361/201423903 | |
| Published online | 09 January 2015 | |
Online material
Appendix A: Spectral energy distributions
We report the SEDs of all 80 FSRQs in our sample within the SDSS area. Those corresponding to the 55 FSRQs with evidence
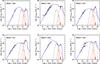 |
Fig. A.1
SEDs of the 55 FSRQs in the sample with evidence of optical/UV bump. The meaning of the lines and of data points is the same as in Fig. 1. The 22 FSRQs for which the χ2 minimization procedure did not produce valid upper limits are flagged with an asterisk. For these sources upper limits to the torus luminosity were derived as described in the text and are reported in the SEDs. For WMAP7 no. 428, which shows tentative evidence of torus, we report both the best fit torus template and the upper limit such that the model does not exceed the MIR WISE measurements. |
| Open with DEXTER | |
of optical/UV bump are in Fig. A.1. The SEDs of the remaining 25 FSRQs with no clear evidence of bump are shown in Fig. A.2.
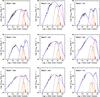 |
Fig. A.1
continued. |
| Open with DEXTER | |
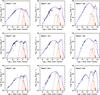 |
Fig. A.1
continued. |
| Open with DEXTER | |
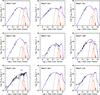 |
Fig. A.1
continued. |
| Open with DEXTER | |
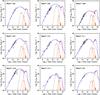 |
Fig. A.1
continued. |
| Open with DEXTER | |
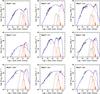 |
Fig. A.1
continued. |
| Open with DEXTER | |
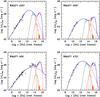 |
Fig. A.1
continued. |
| Open with DEXTER | |
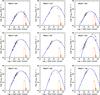 |
Fig. A.2
SEDs of the 25 FSRQs in the sample with no clear evidence of optical/UV bump. The meaning of lines and data points is the same as in Fig. 1. Torus and disk templates are not included in the modeling. |
| Open with DEXTER | |
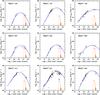 |
Fig. A.2
continued. |
| Open with DEXTER | |
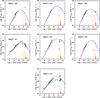 |
Fig. A.2
continued. |
| Open with DEXTER | |
© ESO, 2015
Current usage metrics show cumulative count of Article Views (full-text article views including HTML views, PDF and ePub downloads, according to the available data) and Abstracts Views on Vision4Press platform.
Data correspond to usage on the plateform after 2015. The current usage metrics is available 48-96 hours after online publication and is updated daily on week days.
Initial download of the metrics may take a while.