| Issue |
A&A
Volume 570, October 2014
|
|
|---|---|---|
| Article Number | A89 | |
| Number of page(s) | 24 | |
| Section | Planets and planetary systems | |
| DOI | https://doi.org/10.1051/0004-6361/201423809 | |
| Published online | 22 October 2014 | |
Online material
Appendix A: Chromatic transit light curves
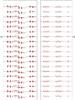 |
Fig. A.1
Left panel: the 107 corrected chromatic light curves of GJ 3470. Data points in all three HST orbits shown (2−4) have been divided by the correction template. The light curves have been offset in flux for clarity. The plain curves are best-fit transit models superimposed to each time series. The grey vertical dotted lines indicate the phase coverage shown in the right panel, where the residuals are plotted. In this panel, the horizontal dashed lines show the zero levels and the dotted lines show the one-standard-deviation levels of the residuals for the in-transit (third) HST orbit only. |
| Open with DEXTER | |
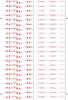 |
Fig. A.1
continued. |
| Open with DEXTER | |
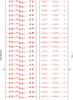 |
Fig. A.1
continued. |
| Open with DEXTER | |
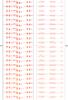 |
Fig. A.1
continued. |
| Open with DEXTER | |
 |
Fig. A.1
continued. |
| Open with DEXTER | |
Appendix B: Transmission spectrum data
Transmission spectrum of GJ 3470b.
© ESO, 2014
Current usage metrics show cumulative count of Article Views (full-text article views including HTML views, PDF and ePub downloads, according to the available data) and Abstracts Views on Vision4Press platform.
Data correspond to usage on the plateform after 2015. The current usage metrics is available 48-96 hours after online publication and is updated daily on week days.
Initial download of the metrics may take a while.