| Issue |
A&A
Volume 568, August 2014
|
|
|---|---|---|
| Article Number | A3 | |
| Number of page(s) | 13 | |
| Section | Planets and planetary systems | |
| DOI | https://doi.org/10.1051/0004-6361/201423762 | |
| Published online | 05 August 2014 | |
Online material
Appendix A: Orbital parameters of the comets
In Table A.1, we show the orbital elements of the comets used during the dynamical studies in Sect. 5. They are extracted from JPL Horizons online solar system data.
Orbital parameters of the short-period comets under study.
Appendix B: Dust environment of the comets in the sample
In this Appendix, we present the evolution of the dust parameters versus heliocentric distance for each comet in the sample (Figs. B.1 to B.7). These parameters are dust production rate [kg/s], ejection velocities for particles of r = 1 cm glassy carbon spheres [m/s], the maximum size of the particles [cm], and the power index of the size distribution (δ). Solid red lines correspond to pre-perihelion, and dashed blue lines to post-perihelion.
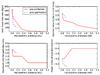 |
Fig. B.1
As in Fig. 4, but for comet 78P/Gehrels 2. |
| Open with DEXTER | |
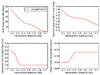 |
Fig. B.2
As in Fig. 4, but for comet 115P/Maury. |
| Open with DEXTER | |
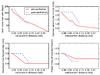 |
Fig. B.3
As in Fig. 4, but for comet 118P/Shoemaker-Levy 4. |
| Open with DEXTER | |
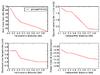 |
Fig. B.4
As in Fig. 4, but for comet 123P/West-Hartley. |
| Open with DEXTER | |
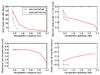 |
Fig. B.5
As in Fig. 4, but for comet 157P/Tritton. |
| Open with DEXTER | |
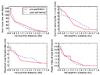 |
Fig. B.6
As in Fig. 4, but for comet 185P/Petriew. |
| Open with DEXTER | |
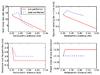 |
Fig. B.7
As in Fig. 4, but for comet P/2011 W2 (Rinner). |
| Open with DEXTER | |
Appendix C: Comparison between observational data and models
In this Appendix (Figs. C.1 to C.7), we show the comparison between the observational data and the models proposed in Sect. 4, which describe the dust environments of the comets of the sample, as in Fig. 5.
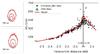 |
Fig. C.1
As in Fig. 5, but for comet 78P/Gehrels 2. Isophote fields: a) December 19, 2011. b) January 4, 2012. In both cases the isophote levels are 0.55 × 10⁻¹², 2.65 × 10⁻¹³, and 1.35 × 10⁻¹³ SDU. |
| Open with DEXTER | |
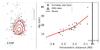 |
Fig. C.2
As in Fig. 5, but for comet 115P/Maury. Isophote fields: July 15, 2011. Isophote levels are 1.00 × 10⁻¹³, 3.00 × 10⁻¹⁴, and 1.30 × 10⁻¹⁴ SDU. |
| Open with DEXTER | |
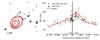 |
Fig. C.3
As in Fig. 5, but for comet 118P/Shoemaker-Levy 4. Isophote fields: December 12, 2009. Isophote levels are 1.50 × 10⁻¹³, 6.00 × 10-143.50 × 10⁻¹⁴, and 2.00 × 10⁻¹⁴ SDU. |
| Open with DEXTER | |
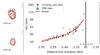 |
Fig. C.4
As in Fig. 5, but for comet 123P/West-Hartley. Isophote fields: a) February 26, 2011. b) March 31, 2011. Isophote levels are 1.00 ×10⁻¹³, 0.35 ×10⁻¹³, and 0.15 ×10⁻¹³ SDU in a) and 1.50 ×10⁻¹³, 0.50 ×10⁻¹³, and 0.25 ×10⁻¹³ SDU in b). |
| Open with DEXTER | |
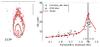 |
Fig. C.5
As in Fig. 5, but for comet 157P/Tritton. Isophote fields: March 10, 2010. Isophote levels are 6.00 × 10⁻¹³, 0.75 × 10⁻¹³, and 2.65×10⁻¹⁴ SDU. |
| Open with DEXTER | |
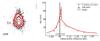 |
Fig. C.6
As in Fig. 5, but for comet 185P/Petriew. Isophote fields: July 15, 2012. Isophote levels are 1.80 × 10⁻¹³, 1.00×10-130.60×10⁻¹³, and 0.35 × 10⁻¹³ SDU. |
| Open with DEXTER | |
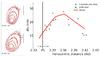 |
Fig. C.7
As in Fig. 5, but for comet P/2011 W2 (Rinner). Isophote fields: a) December 22, 2011. b) January 4. In both cases the isophote are 6.00 ×10⁻¹⁴, 2.70 ×10⁻¹⁴, 1.50 ×10⁻¹⁴, and 0.80 ×10⁻¹⁴ SDU. |
| Open with DEXTER | |
© ESO, 2014
Current usage metrics show cumulative count of Article Views (full-text article views including HTML views, PDF and ePub downloads, according to the available data) and Abstracts Views on Vision4Press platform.
Data correspond to usage on the plateform after 2015. The current usage metrics is available 48-96 hours after online publication and is updated daily on week days.
Initial download of the metrics may take a while.