| Issue |
A&A
Volume 567, July 2014
|
|
|---|---|---|
| Article Number | A28 | |
| Number of page(s) | 19 | |
| Section | Stellar structure and evolution | |
| DOI | https://doi.org/10.1051/0004-6361/201323286 | |
| Published online | 08 July 2014 | |
Online material
Appendix A: Synthetic spectra of the triple system HD 156324
To interpret the complex spectrum of HD 156324, we have modified the code BINMAG developed by Oleg Kochukhov to compute the combined spectrum of a triple-lined spectroscopic binary. This code uses individual ATLAS9/SYNTH spectra (Sect. 3.1) and the stellar fluxes computed by SYNTH to calculate the normalised spectrum of the system. Instrumental, macroturbulent, and rotational broadening, as well as radial velocity shifts have been applied to each individual spectrum using a Gaussian function (for the instrumental and macroturbulent broadening), and Gray (1992)’s formalism (for the rotation). The code also requires as input the radii ratios of the primary to the secondary (RP/RS), and of the secondary to the tertiary (RS/RT). The macrotubulent and radial velocities, the v sin i, and the radii ratios are all adjustable parameters. The effective temperatures and gravities of the components can be adjusted by loading different synthetic spectra.
Little is known about the system HD 156324. While some parameters can be unambiguously estimated using our observations (v sin i and vrad), some others are much more difficult to constrain because of the degenerated effects they have on a spectrum (Teff, abundances, radii ratios). An additional difficulty can appear when the spectra are variable and distorted, which seems to be the case for the primary component of HD 156324. Such degeneracy and difficulties can be overcome when a large dataset, in which variability can be studied and understood is obtained. With our small dataset we can therefore only perform an approximate fit to the data, and derive very approximate values of the parameters. We have not attempted to fit the surface gravities and the macro turbulent velocities of the stars, and we fixed their values to 4.0 (cgs) and 0 km s-1, respectively, which are typical for main-sequence stars at these temperatures. While approximate,
this eye-fitting procedure allowed us to attribute the three components identified in our spectra of HD 156324 to three different stellar photospheres, and to identify strong abundance peculiarities in the primary and the tertiary.
Effective temperatures and radii ratio of our synthetic spectra.
Figures A.1 and A.2 show the results of some of the best fits that we could achieve for the three observations of HD 156324 around 4470 Å and 6370 Å. They illustrate the over- and under-abundances of the respective He i and Si ii lines from the primary, while the Ne i 6402 Å line is relatively well fit for the primary and secondary. The Si ii lines are also relatively well fit for the secondary; however the depth of the lines of the third component are in general not well reproduced. In Table A.1 are reported the effective temperatures and radii ratio that were used in these plots. We note that we can also achieve a reasonably good fit of our data using different values of the secondary and tertiary temperatures (between 14 000 and 17 000 K), and different values of radii ratio (between 1 and 3 for RP/RS, and between 0.5 and 1.5 for RS/RP). Table A.1 also illustrates our inability to fit all of our observations at the same time using a unique set of values. The complexity and the variability of the spectra are most likely the reason for this difficulty. We note that a unique set of parameters could be determined for both observations obtained when the primary and secondary components are not blended. Additional observations at various orbital phases are required for a better estimation of the stellar parameters.
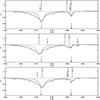 |
Fig. A.1
Intensity spectra of HD 156324 around He i 4471 Å and Mg ii 4481 Å of the first, second, and third (top to bottom) observations. The combined synthetic spectra of the triple system are over plotted in each panel with full dark grey lines. The contributions of the three components relative to the combined stellar flux of the system are over plotted in dot-dashed light-grey lines.The position of the strongest lines of the primary (P), secondary (S), and tertiary (T) components are indicated with vertical bars. |
| Open with DEXTER | |
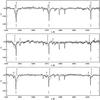 |
Fig. A.2
Same as Fig. A.1 but in a region of the spectrum containing the lines Si ii 6347 Å, Si ii 6371 Å and Ne ii 6402 Å. |
| Open with DEXTER | |
© ESO, 2014
Current usage metrics show cumulative count of Article Views (full-text article views including HTML views, PDF and ePub downloads, according to the available data) and Abstracts Views on Vision4Press platform.
Data correspond to usage on the plateform after 2015. The current usage metrics is available 48-96 hours after online publication and is updated daily on week days.
Initial download of the metrics may take a while.