| Issue |
A&A
Volume 566, June 2014
|
|
|---|---|---|
| Article Number | A112 | |
| Number of page(s) | 21 | |
| Section | Extragalactic astronomy | |
| DOI | https://doi.org/10.1051/0004-6361/201423646 | |
| Published online | 20 June 2014 | |
Online material
Appendix A: ALMA cycle 0 data
Lines detected at z = 0.89 toward PKS 1830−211 in the ALMA cycle 0 survey.
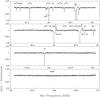 |
Fig. A.1
ALMA cycle 0 B3–100 GHz spectra, after self-bandpass of the SW spectra by the NE spectra. Absorption lines from the SW line-of-sight appear as <1-feature, while the absorption lines from the NE line-of-sight appear as >1-feature. |
| Open with DEXTER | |
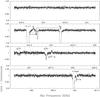 |
Fig. A.2
ALMA cycle 0 B6–250 GHz spectra, after self-bandpass of the SW spectra by the NE spectra. Absorption lines from the SW line-of-sight appear as <1-feature, while the absorption lines from the NE line-of-sight appear as >1-feature. |
| Open with DEXTER | |
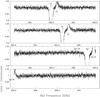 |
Fig. A.3
ALMA cycle 0 B7–290 GHz spectra, after self-bandpass of the SW spectra by the NE spectra. Absorption lines from the SW line-of-sight appear as <1-feature, while the absorption lines from the NE line-of-sight appear as >1-feature. |
| Open with DEXTER | |
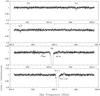 |
Fig. A.4
ALMA cycle 0 B7–300 GHz spectra, after self-bandpass of the SW spectra by the NE spectra. Absorption lines from the SW line-of-sight appear as <1-feature, while the absorption lines from the NE line-of-sight appear as >1-feature. |
| Open with DEXTER | |
O3 atmospheric lines in the observed bands.
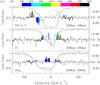 |
Fig. A.5
Time variations toward the SW image between 2012 April 09 and 2012 May 23. |
| Open with DEXTER | |
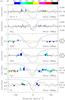 |
Fig. A.6
Time variations toward the SW image between 2012 May 22 and 2012 Jun 04. |
| Open with DEXTER | |
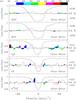 |
Fig. A.7
Time variations toward the SW image between 2012 Jun. 04 and 2012 Jun. 15. |
| Open with DEXTER | |
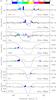 |
Fig. A.8
Time variations toward the SW image between 2012 May 22 and 2012 Jun. 15. |
| Open with DEXTER | |
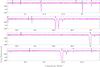 |
Fig. A.9
Composite ALMA B3 spectra (observed in 2012, in black) overlaid on top of the ATCA-3mm spectra obtained in July 2011 (in magenta) by Muller et al. (2013). The ALMA spectra has been recomposed using the spectra from both images (unresolved in the ATCA observations), assuming ℜ = FNE/FSW = 1.35, fc(SW) = 92%, and fc(NE) = 100%. |
| Open with DEXTER | |
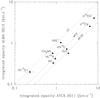 |
Fig. A.10
Comparison of the integrated opacities of the same lines between ATCA observations in July 2011 and ALMA observations in spring 2012. |
| Open with DEXTER | |
© ESO, 2014
Current usage metrics show cumulative count of Article Views (full-text article views including HTML views, PDF and ePub downloads, according to the available data) and Abstracts Views on Vision4Press platform.
Data correspond to usage on the plateform after 2015. The current usage metrics is available 48-96 hours after online publication and is updated daily on week days.
Initial download of the metrics may take a while.