| Issue |
A&A
Volume 566, June 2014
|
|
|---|---|---|
| Article Number | A139 | |
| Number of page(s) | 16 | |
| Section | The Sun | |
| DOI | https://doi.org/10.1051/0004-6361/201423461 | |
| Published online | 26 June 2014 | |
Online material
Appendix A: Fe I 5250.2 Stokes profiles
Inspired by the results of Borrero et al. (2010), who first analyzed the quiet-Sun jets detected by Sunrise/IMaX and the possible detection of similar events by the later work of Martínez Pillet et al. (2011b), we synthesized the 5250 Å spectral region (including the IMaX Fe i line and the neighboring Fe i 5250.6 Å line) using the atmosphere obtained in Sect. 5.
Figure A.1 shows the results of this synthesis. We only displayed Stokes I and V because the inclination angle was fixed to zero degrees during the inversion process. Because of the high sensitivity of the Fe i 5250.2 Å line to the temperature, the Stokes I parameter is very weak for these models. The second line, Fe i 5250.6 Å, is less sensitive to the temperature and has a well-defined shape with the red wing strongly bent because of the high velocity gradients inside the atmosphere. The Fe i 5250.6 Å line has a higher line formation region and is less sensitive to the magnetic field. However, similarly to the
Fe i 6301.5 and 6302.5 Å lines measured by Hinode/SP, the Stokes V amplitude signal is higher and the bump is more prominent in the line with the higher formation region. The bump has almost vanished in the line employed by the IMaX instrument, Fe 5250.2 Å.
We assumed that these events, because of the steep temperature gradients and the large heights of formation in the photosphere, were not detected by the line used by IMaX, even without the degradation effect produced by the spectral PSF of the instrument. The bump inside the profile of the second line has almost vanished, although in the last two steps it is still visible. The IMaX instrument would able to detect these events if it were measuring the second line. For this reason we have to assume that the events analyzed by Borrero et al. (2010) and the subsequent studies (Borrero et al. 2012, 2013; Quintero Noda et al. 2013) examined a different physical process. In fact, they established that most of the cases were upflow events and were related with linear polarization patches.
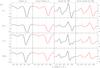 |
Fig. A.1
Synthetic Stokes I and V profiles for the Fe i 5250.2 and 5250.6 Å lines. We have used the atmospheres presented in Fig. 5. Black lines are the original synthetic profile, while the red lines are the profiles after degrading them to the spectral resolution of IMaX. The dotted line designates the rest center of each line. |
| Open with DEXTER | |
© ESO, 2014
Current usage metrics show cumulative count of Article Views (full-text article views including HTML views, PDF and ePub downloads, according to the available data) and Abstracts Views on Vision4Press platform.
Data correspond to usage on the plateform after 2015. The current usage metrics is available 48-96 hours after online publication and is updated daily on week days.
Initial download of the metrics may take a while.