| Issue |
A&A
Volume 566, June 2014
|
|
|---|---|---|
| Article Number | A125 | |
| Number of page(s) | 18 | |
| Section | Stellar atmospheres | |
| DOI | https://doi.org/10.1051/0004-6361/201322894 | |
| Published online | 23 June 2014 | |
Online material
Appendix A: Observation logs
Observation log of AMBER.
Appendix B: 2006−2007 campaign
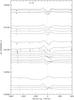 |
Fig. B.1
2006−2007 Hα time series of Rigel obtained with FEROS. |
| Open with DEXTER | |
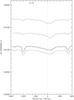 |
Fig. B.2
2006−2007 Brγ time series of Rigel obtained with AMBER. |
| Open with DEXTER | |
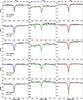 |
Fig. B.3
Differential visibilities of Rigel obtained in 2006−2007 and put to the scale corresponding to an angular diameter of 2.75 mas. The visibilities are compared with the ones computed from CMFGEN models tuning the mass-loss rate only. |
| Open with DEXTER | |
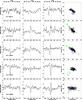 |
Fig. B.4
Differential phases and photocentre shift of Rigel obtained in 2006−2007. |
| Open with DEXTER | |
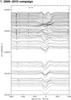 |
Fig. C.1
2009−2010 Hα time series of Rigel obtained with BESO. |
| Open with DEXTER | |
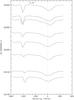 |
Fig. C.2
2009−2010 Brγ time series of Rigel obtained with AMBER. |
| Open with DEXTER | |
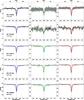 |
Fig. C.3
Differential visibilities of Rigel obtained obtained in 2009−2010 and put to the scale corresponding to an angular diameter of 2.75 mas. The visibilities are compared with the ones computed from CMFGEN models with varying mass-loss rate. |
| Open with DEXTER | |
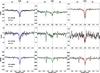 |
Fig. C.4
Differential visibilities of Rigel obtained in 2009−2010 (continued). |
| Open with DEXTER | |
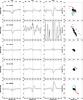 |
Fig. C.5
Differential phases and photocentre shift of Rigel obtained in 2009−2010. |
| Open with DEXTER | |
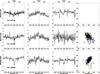 |
Fig. C.6
Differential phases and photocentre shift of Rigel obtained in 2009−2010 (continued). At MJD = 55 267.099 (upper row), the baselines were aligned preventing the computation of a 2D photocentre. |
| Open with DEXTER | |
© ESO, 2014
Current usage metrics show cumulative count of Article Views (full-text article views including HTML views, PDF and ePub downloads, according to the available data) and Abstracts Views on Vision4Press platform.
Data correspond to usage on the plateform after 2015. The current usage metrics is available 48-96 hours after online publication and is updated daily on week days.
Initial download of the metrics may take a while.