| Issue |
A&A
Volume 565, May 2014
|
|
|---|---|---|
| Article Number | A36 | |
| Number of page(s) | 27 | |
| Section | Interstellar and circumstellar matter | |
| DOI | https://doi.org/10.1051/0004-6361/201423395 | |
| Published online | 29 April 2014 | |
Online material
Log of HerPlaNS observations.
Appendix A: PACS SED range spectroscopy spectral maps
Figures A.1 and A.1 show spatially varying emission lines of NGC 6781 other than those already presented in Fig. 10. Displayed are all 50 spectra extracted from each of the 5 × 5 spaxels at each of the two spatial pointings on the eastern rim (left) and at the center (right). These spectra show that the relative strengths of these ionic, atomic, and molecular lines change depending on the spaxel position along each line of sight within the PACS IFU aperture. The approximate spatial correspondence of the 50 spaxels to the 70 μm broadband map is shown by the color-scale surface brightness map in the background. Within the central ionized region, ionic lines ([O iii] and [N iii]) are strong (seen in the spaxels of the western half of the “rim” pointing and of the “center” pointing). While moving laterally away from the center of the nebula to outer regions along the plane of the sky via the eastern rim, the largest change of the relative strengths of lines occurs when going across the rim at which the ionic lines become weaker and atomic lines ([O i], [N ii], and [C ii]) become stronger. This transition region, however, is physically very restricted as the change is seen across nearly only one-spaxel width.
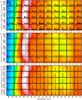 |
Fig. A.1
Spatially varying line emission of NGC 6781 at [O iii] 51.8 μm, [O i] 63.2 μm, and [O iii] 88.4 μm in each of the two pointings toward NGC 6781 shown side by side: “center” on the right and “rim” on the left. To specify the instrument orientation, corner spaxels are identified by their identifiers. The flux unit is set to the surface brightness (mJy arcsec-2). The background PACS 70 μm image indicates the approximate location of each spaxel. Ionic lines tend to be strong in the highly ionized cavity of the cylindrical structure, while atomic and molecular lines tend to be pronounced in the cylindrical rim of the nebula. Note that the footprint of the PACS IFU is not a regular grid as implied by the placement of the sub-plots; the slightly irregular footprint can be seen in Figs. 6 and 11. |
| Open with DEXTER | |
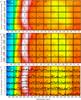 |
Fig. A.1
continued. Spatially varying line emission of NGC 6781 at [O i] 145.6 μm, [C ii] 157.8 μm, and [N ii] 205.2 μm. |
| Open with DEXTER | |
Appendix B: SPIRE FTS high-spectral resolution spectral maps
Figures B.1 and B.2 show all 70 spectra extracted from each of the two pointings of the 35-bolometer SSW array (2 bolometers are blind – they are left blank in the map), covering 194−342 μm, and all 38 spectra extracted from each of the two pointings of the 19-bolometer SLW array, covering 316–672 μm, respectively. The entire SPIRE wavelength coverage from 194–672 μm is achieved in at least 16 locations (which are shown as Fig. 9 in the main text). These spectra show that the relative strengths of the ionic [N ii] line in the SSW spectral range and CO rotational lines in the SLW spectral range, vary depending on the bolometer position within the target nebula. Within the central ionized region, both atomic and molecular lines are weaker than in the ring structure. In both SSW and SLW spectral ranges, however, the line strengths suddenly decrease once the line of sight goes beyond the central ionized region, suggesting that the presence of the gas component in the nebula is fairly spatially restricted – not much beyond the central ionized region and the cylindrical barrel structure.
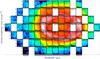 |
Fig. B.1
Pseudo-mosaic SPIRE spectral maps constructed with individual spectra from each SSW/SLW bolometer: all 70 SPIRE/SSW spectra covering 194–342 μm extracted from each of the 35 bolometers (two bolometers are blind) at two pointings. The background PACS 70 μm map is shown to indicate the approximate spatial coverage of each SPIRE bolometer at each of the two pointings. The image is rotated by 90° to make individual panels sufficiently large for printing. |
| Open with DEXTER | |
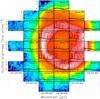 |
Fig. B.2
Pseudo-mosaic SPIRE spectral maps constructed with individual spectra from each SSW/SLW bolometer: all 38 SPIRE/SLW spectra covering 316–672 μm extracted from each of the 19 bolometers at two pointings. The background PACS 70 μm map is shown to indicate the approximate spatial coverage of each SPIRE bolometer at each of the two pointings. |
| Open with DEXTER | |
© ESO, 2014
Current usage metrics show cumulative count of Article Views (full-text article views including HTML views, PDF and ePub downloads, according to the available data) and Abstracts Views on Vision4Press platform.
Data correspond to usage on the plateform after 2015. The current usage metrics is available 48-96 hours after online publication and is updated daily on week days.
Initial download of the metrics may take a while.