| Issue |
A&A
Volume 563, March 2014
|
|
|---|---|---|
| Article Number | L3 | |
| Number of page(s) | 7 | |
| Section | Letters | |
| DOI | https://doi.org/10.1051/0004-6361/201323024 | |
| Published online | 25 February 2014 | |
Online material
Appendix A: The 3.2 mm continuum emission
Figure A.1 shows the emission map of the 3.2 mm continuum dust emission, which was produced as the 1.4 mm map using robust weighting, and restored with a clean beam of  (PA = 38°). The 3.2 mm emission allows us to detect the MM1 (α(J2000): 03h 28m 55
 56, δ(J2000): +31° 14′ 36
 93) and MM2 (α(J2000): 03h 28m 5569, δ(J2000): +31° 14′ 3563) sources, consistent with what was found in the 1.4 mm image (see Table 1 and Fig. 1). The peak fluxes are 17 mJy beam-1 and 2 mJy beam-1 for MM1 and MM2, respectively. On the other hand, MM3 (revealed at 1.4 mm) is not detected at a 3σ sensitivity level of 0.75 mJy beam-1.
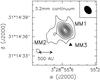 |
Fig. A.1
Contour plots of the IRAS2A continuum emission at 3.2 mm. The ellipse shows the PdBI synthesised beam (HPBW): |
| Open with DEXTER | |
Appendix B: SiO and SO channel maps
We show in Figs. A.1 and A.2 the channel maps of the SiO(5–4) and SO(65–54) blue- and redshifted (continuum subtracted) emissions towards IRAS2A. The images trace the clumps well at different velocities along the N-S jet driven by MM1 and also trace the redshifted E lobe associated with MM2. The grey lines show the deceleration of the highest velocity clumps.
Figure A.3 shows the SiO and SO PV diagrams along the E-W jet axis: as in the N-S case, the SiO emitting at the highest velocities is closely associated with the driving source MM2, confirming that SiO is a powerful tracer of the jet launching region.
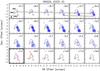 |
Fig. B.1
Channel maps of the SiO(5–4) blue- and redshifted (continuum subtracted) emissions towards IRAS2A. Each panel shows the emission integrated over a velocity interval of 2.5 km s-1 centred at the value given in the upper-right corner. The thick box and the magenta contours indicate the range associated with the systemic velocity. Thick contours correspond to the 5σ emission of the 1.4 mm continuum map shown in Fig. 1 and indicate the position of the MM1, MM2, and MM3 continuum sources. The ellipse in the top-left panel shows the PdBI synthesised beam (HPBW): |
| Open with DEXTER | |

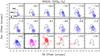 |
Fig. B.2
Channels map of the SO(65–54) blue- and redshifted (continuum subtracted) emissions towards IRAS2A. Each panel shows the emission integrated over a velocity interval of 2.7 km s-1 centred at the value given in the upper-right corner. Symbols are drawn as in Fig. 2. The ellipse in the top-left panel shows the PdBI synthesised beam (HPBW): |
| Open with DEXTER | |
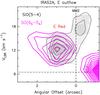 |
Fig. B.3
Position-velocity cut of SiO(5–4) (grey scale and black contours) and SO(65–54) (magenta contours) along the whole E-W jet (PA = 105°, see the grey line in Fig. 1). First contours and steps correspond to 5σ (2.5 K for SiO and 4.0 K for SO) and 3σ, respectively. Dashed lines mark the positions of MM2 and the protostellar envelope VLSR (+6.5 km s-1). We note that the SiO and SO emission at negative angular offsets traces the N-S outflow driven by MM1 (see Fig. 1). |
| Open with DEXTER | |
© ESO, 2014
Current usage metrics show cumulative count of Article Views (full-text article views including HTML views, PDF and ePub downloads, according to the available data) and Abstracts Views on Vision4Press platform.
Data correspond to usage on the plateform after 2015. The current usage metrics is available 48-96 hours after online publication and is updated daily on week days.
Initial download of the metrics may take a while.