| Issue |
A&A
Volume 563, March 2014
|
|
|---|---|---|
| Article Number | A97 | |
| Number of page(s) | 31 | |
| Section | Interstellar and circumstellar matter | |
| DOI | https://doi.org/10.1051/0004-6361/201322541 | |
| Published online | 17 March 2014 | |
Online material
Source list showing the position, the distance, and the evolutionary stage of all high-mass star-forming regions.
Appendix A: Appendix material
Integrated intensity  in K km s-1.
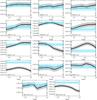 |
Fig. A.1
Modeled and observed median column densities in cm-2 in the IRDC stage. The modeled values are shown in black and the observed values in blue. The error bars are given by the vertical marks. The molecule name is labeled in the plot. |
| Open with DEXTER | |
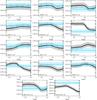 |
Fig. A.2
Modeled and observed median column densities in cm-2 in the HMPO stage. The modeled values are shown in black and the observed values in blue. The error bars are given by the vertical marks. The molecule name is labeled in the plot. |
| Open with DEXTER | |
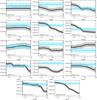 |
Fig. A.3
Modeled and observed median column densities in cm-2 in the HMC stage. The modeled values are shown in black and the observed values in blue. The error bars are given by the vertical marks. The molecule name is labeled in the plot. |
| Open with DEXTER | |
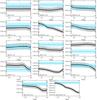 |
Fig. A.4
Modeled and observed median column densities in cm-2 in the UCHii stage. The modeled values are shown in black and the observed values in blue. The error bars are given by the vertical marks. The molecule name is labeled in the plot. |
| Open with DEXTER | |
© ESO, 2014
Current usage metrics show cumulative count of Article Views (full-text article views including HTML views, PDF and ePub downloads, according to the available data) and Abstracts Views on Vision4Press platform.
Data correspond to usage on the plateform after 2015. The current usage metrics is available 48-96 hours after online publication and is updated daily on week days.
Initial download of the metrics may take a while.