| Issue |
A&A
Volume 562, February 2014
|
|
|---|---|---|
| Article Number | A32 | |
| Number of page(s) | 16 | |
| Section | Galactic structure, stellar clusters and populations | |
| DOI | https://doi.org/10.1051/0004-6361/201322100 | |
| Published online | 04 February 2014 | |
Online material
Appendix A: Population boxes in the VISTA near-infrared CMD
Table A.1 indicates the exact boundaries of the regions used in this study to select stars of a different type from the near-infrared CMD of the combined VMC-2MASS sample. Column 1 indicates the CMD region and Cols. 2–4 mark the boundaries of each region, where values refer to 2MASS magnitudes, while Col. 5 lists the types of stars included in each region. The percentage of MW stars is shown within parentheses. CMD regions have been derived from Nikolaev & Weinberg (2000) using 2MASS All-Sky data, and their Table 2 values have been revised using their figures and extended to include faint magnitudes from the 2MASS 6 × catalogue. In particular, region D has been split into two parts to distinguish MW stars from LMC stars.
Similarly, Table A.2 indicates the exact boundaries to select stars of a different mean age from the near-infrared CMD of VMC stars reaching sensitivities well below the sensitivity of 2MASS observations. Column 1 indicates the CMD region and Cols. 2 and 3 mark the boundaries of each region, where values are in the Vega magnitude scale. Column 4 lists the type of stars and the median age of LMC stars while Col. 5 shows the percentage of MW stars. CMD regions have been derived from the analysis of the star formation history within tile LMC 8_8 by Rubele et al. (2012). In particular, this tile represents on average AV ~ 0.2 mag and (m − M)0 ~ 18.39 mag and contains old stars (log (t/yr) > 10.0) and stars resulting from three additional episodes of star formation: one at log (t/yr) = 9.9 that formed ~31% of the stellar mass, one at log (t/yr) = 9.1 − 9.3 that formed ~21% of the stellar mass, and one at log (t/yr) = 8.5 − 8.7 for stars in the part of the tile that is closer to the LMC centre with very little star formation at log (t/yr) < 8.3.
Stellar types in 2MASS data (Ks < 15.5 mag).
Stellar ages in VMC data (Ks > 13 mag).
Appendix B: Proper motion trends
Figures B.1 and B.2 show the PM as functions of Ks magnitude, (J − Ks) colour and position, right ascension (α), and declination (δ) for LMC stars in regions ABCDEGHIJK of Fig. 10. Similar plots for galaxies in region L are shown in Figs. B.3 and B.4. Horizontal lines through the data indicate the corresponding mean PM for stars in the region. An oscillating component, clearly visible in the bottom-right panel of Fig. B.2 (μδ vs. δ), appears symmetric with respect to the centre of the distribution and would not therefore influence the resulting mean PMs. This effect is probably due to astrometric differences among the VISTA detectors where eight of them approximately cover each axis. We note that these figures include all points prior to the 3σ clipping procedure applied to derive mean PM values.
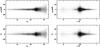 |
Fig. B.1
Proper motion in mas yr-1 as functions of Ks magnitude (left) and (J − Ks) colour (right) for all LMC sources of Fig. 10. |
| Open with DEXTER | |
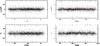 |
Fig. B.2
Proper motion in mas yr-1 as functions of right ascension (left) and declination (right) for all LMC sources of Fig. 10. |
| Open with DEXTER | |
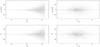 |
Fig. B.3
Proper motion in mas yr-1 as functions of Ks magnitude (left) and (J − Ks) colour (right) for galaxies in region L of Fig. 10. |
| Open with DEXTER | |
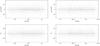 |
Fig. B.4
Proper motion in mas yr-1 as functions of right ascension (left) and declination (right) for galaxies in region L of Fig. 10. |
| Open with DEXTER | |
© ESO, 2014
Current usage metrics show cumulative count of Article Views (full-text article views including HTML views, PDF and ePub downloads, according to the available data) and Abstracts Views on Vision4Press platform.
Data correspond to usage on the plateform after 2015. The current usage metrics is available 48-96 hours after online publication and is updated daily on week days.
Initial download of the metrics may take a while.