| Issue |
A&A
Volume 559, November 2013
|
|
|---|---|---|
| Article Number | A84 | |
| Number of page(s) | 20 | |
| Section | Interstellar and circumstellar matter | |
| DOI | https://doi.org/10.1051/0004-6361/201321122 | |
| Published online | 20 November 2013 | |
Online material
Appendix A: Detection of CO transitions
In Table A.1, we list the transitions that were detected in our PACS spectra, while we show windows around the position of the CO lines for those objects where CO line emission was detected in Figs. A.1 to A.8.
CO Transitions detected in the PACS SED scans.
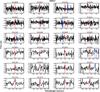 |
Fig. A.1
Spectra of AB Aur, centered on the CO lines, indicated in red. The OH line at 84.42 μm blends with the CO J = 31 → 30 line. In blue, we indicate the positions of other lines (CH+ at 90 μm and [O i] at 145 μm; rest are OH doublets). |
| Open with DEXTER | |
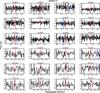 |
Fig. A.2
Spectra of HD 36112, centered on the CO lines, indicated in red. The OH line at 84.42 μm blends with the CO J = 31 → 30 line. In blue, we indicate the positions of other lines (CH+ at 90 μm and [O i] at 145 μm; rest are OH doublets). |
| Open with DEXTER | |
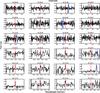 |
Fig. A.3
Spectra of HD 97048, centered on the CO lines, indicated in red. The OH line at 84.42 μm blends with the CO J = 31 → 30 line. In blue, we indicate the positions of other lines (CH+ at 90 μm and [O i] at 145 μm; rest are OH doublets). |
| Open with DEXTER | |
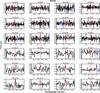 |
Fig. A.4
Spectra of IRS 48, centered on the CO lines, indicated in red. The OH line at 84.42 μm blends with the CO J = 31 → 30 line. In blue, we indicate the positions of other lines (CH+ at 90 μm and [O i] at 145 μm; rest are OH doublets). |
| Open with DEXTER | |
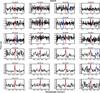 |
Fig. A.5
Spectra of AS 205, centered on the CO lines, indicated in red. The OH line at 84.42 μm blends with the CO J = 31 → 30 line. In blue, we indicate the positions of other lines (CH+ at 90 μm and [O i] at 145 μm; rest are OH doublets). |
| Open with DEXTER | |
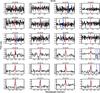 |
Fig. A.6
Spectra of S CrA, centered on the CO lines, indicated in red. The OH line at 84.42 μm blends with the CO J = 31 → 30 line. In blue, we indicate the positions of other lines (CH+ at 90 μm and [O i] at 145 μm; rest are OH doublets). |
| Open with DEXTER | |
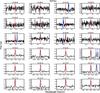 |
Fig. A.7
Spectra of DG Tau, centered on the CO lines, indicated in red. The OH line at 84.42 μm blends with the CO J = 31 → 30 line. In blue, we indicate the positions of other lines (CH+ at 90 μm and [O i] at 145 μm; rest are OH doublets). |
| Open with DEXTER | |
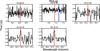 |
Fig. A.8
Spectra of RU Lup, centered on the CO lines, indicated in red. In blue, we indicate the position of OH lines. |
| Open with DEXTER | |
Appendix B: Upper limits
In Tables B.1 and B.2, we give the upper limits at a few key transitions (J36 → 35, 29 → 28, 23 → 22, 18 → 17, and 15 → 14) for those sources where not a single CO emission line was detected.
CO upper limits at selected wavelengths for the sources with full SEDs scans (50–200 μm) in W/m2 × 10-18.
CO upper limits for the sources with the forsterite scans (60–71 μm + 120–143 μm) in W/m2 × 10-18.
© ESO, 2013
Current usage metrics show cumulative count of Article Views (full-text article views including HTML views, PDF and ePub downloads, according to the available data) and Abstracts Views on Vision4Press platform.
Data correspond to usage on the plateform after 2015. The current usage metrics is available 48-96 hours after online publication and is updated daily on week days.
Initial download of the metrics may take a while.