| Issue |
A&A
Volume 556, August 2013
|
|
|---|---|---|
| Article Number | A3 | |
| Number of page(s) | 7 | |
| Section | Planets and planetary systems | |
| DOI | https://doi.org/10.1051/0004-6361/201321497 | |
| Published online | 16 July 2013 | |
Online material
Appendix A: GLS periodograms for simulated RV measurements
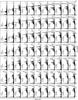 |
Fig. A.1
GLS periodogram for sine functions with different periods and velocity semi-amplitudes. The fit displayed in Fig. 1 was added to each sine function to account for the inaccurate barycentric correction by the FEROS-DRS. The period and velocity semi-amplitude used to compute the sine function are displayed in the legend of the individual plots. The red dashed line represents the position of the period applied to compute the sine function. The blue dashed line marks a one-year period. |
| Open with DEXTER | |
Appendix B: Accompanying table
Observation log.
© ESO, 2013
Current usage metrics show cumulative count of Article Views (full-text article views including HTML views, PDF and ePub downloads, according to the available data) and Abstracts Views on Vision4Press platform.
Data correspond to usage on the plateform after 2015. The current usage metrics is available 48-96 hours after online publication and is updated daily on week days.
Initial download of the metrics may take a while.