| Issue |
A&A
Volume 556, August 2013
|
|
|---|---|---|
| Article Number | A11 | |
| Number of page(s) | 20 | |
| Section | Extragalactic astronomy | |
| DOI | https://doi.org/10.1051/0004-6361/201220258 | |
| Published online | 17 July 2013 | |
Online material
Appendix A
Here we present the zCOSMOS stacked spectra that were in our study.
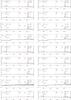 |
Fig. A.1
Stacked zCOSMOS spectra at lower z. Bin 9.25 ≤ log M∗/M⊙ < 9.5, 0.177 ≤ z < 0.242 (panel a)); 9.5 ≤ log M∗/M⊙ < 9.75, 0.177 ≤ z < 0.242 (panel b)); 9.75 ≤ log M∗/M⊙ < 10, 0.177 ≤ z < 0.242 (panel c)); 10 ≤ log M∗/M⊙ < 10.25, 0.177 ≤ z < 0.242 (panel d)); 10.25 ≤ log M∗/M⊙ < 10.5, 0.177 ≤ z < 0.242 (panel e)); 10.5 ≤ log M∗/M⊙ < 10.75, 0.177 ≤ z < 0.242 (panel f)); 10.75 ≤ log M∗/M⊙ < 11, 0.177 ≤ z < 0.242 (panel g)); 9 ≤ log M∗/M⊙ < 9.25, 0.242 ≤ z < 0.306 (panel h)); 9.25 ≤ log M∗/M⊙ < 9.5, 0.242 ≤ z < 0.306 (panel i)); 9.5 ≤ log M∗/M⊙ < 9.75, 0.242 ≤ z < 0.306 (panel j)); 9.75 ≤ log M∗/M⊙ < 10, 0.242 ≤ z < 0.306 (panel k)); 10 ≤ log M∗/M⊙ < 10.25, 0.242 ≤ z < 0.306 (panel l)); 10.25 ≤ log M∗/M⊙ < 10.5, 0.242 ≤ z < 0.306 (panel m)); 10.5 ≤ log M∗/M⊙ < 10.75, 0.242 ≤ z < 0.306 (panel n)); 10.75 ≤ log M∗/M⊙ < 11, 0.242 ≤ z < 0.306 (panel o)); 11 ≤ log M∗/M⊙ < 11.25, 0.242 ≤ z < 0.306 (panel p)); 9.25 ≤ log M∗/M⊙ < 9.5, 0.306 ≤ z < 0.371 (panel q)); 9.5 ≤ log M∗/M⊙ < 9.75, 0.306 ≤ z < 0.371 (panel r)); 9.75 ≤ log M∗/M⊙ < 10, 0.306 ≤ z < 0.371 (panel s)); 10 ≤ log M∗/M⊙ < 10.25, 0.306 ≤ z < 0.371 (panel t)); 10.25 ≤ log M∗/M⊙ < 10.5, 0.306 ≤ z < 0.371 (panel u)); 10.5 ≤ log M∗/M⊙ < 10.75, 0.306 ≤ z < 0.371 (panel v)); 10.75 ≤ log M∗/M⊙ < 11, 0.306 ≤ z < 0.371 (panel w)); 11 ≤ log M∗/M⊙ < 11.25, 0.306 ≤ z < 0.371 (panel x)); 9.25 ≤ log M∗/M⊙ < 9.5, 0.371 ≤ z ≤ 0.436 (panel y)); 9.5 ≤ log M∗/M⊙ < 9.75, 0.371 ≤ z ≤ 0.436 (panel z)); 9.5 ≤ log M∗/M⊙ < 9.75, 0.371 ≤ z ≤ 0.436 (panel a2)); 9.75 ≤ log M∗/M⊙ < 10, 0.371 ≤ z ≤ 0.436 (panel b2))); 10 ≤ log M∗/M⊙ < 10.25, 0.371 ≤ z ≤ 0.436 (panel c2)); 10.25 ≤ log M∗/M⊙ < 10.5, 0.371 ≤ z ≤ 0.436 (panel d2)); 10.5 ≤ log M∗/M⊙ < 10.75, 0.371 ≤ z ≤ 0.436 (panel e2)); 10.75 ≤ log M∗/M⊙ < 11, 0.371 ≤ z ≤ 0.436 (panel f2)); 11 ≤ log M∗/M⊙ < 11.25, 0.371 ≤ z ≤ 0.436 (panel g2)). |
| Open with DEXTER | |
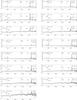 |
Fig. A.1
continued. |
| Open with DEXTER | |
 |
Fig. A.2
Stacked zCOSMOS spectra at higher z. Bin 9.5 ≤ log M∗/M⊙ < 9.75, 0.548 ≤ z < 0.632 (panel a)); 9.75 ≤ log M∗/M⊙ < 10, 0.548 ≤ z < 0.632 (panel b)); 10 ≤ log M∗/M⊙ < 10.25, 0.548 ≤ z < 0.632 (panel c)); 10.25 ≤ log M∗/M⊙ < 10.5, 0.548 ≤ z < 0.632 (panel d)); 10.5 ≤ log M∗/M⊙ < 10.75, 0.548 ≤ z < 0.632 (panel e)); 10.75 ≤ log M∗/M⊙ < 11, 0.548 ≤ z < 0.632 (panel f)); 11 ≤ log M∗/M⊙ < 11.25, 0.548 ≤ z < 0.632 (panel g)); 9.5 ≤ log M∗/M⊙ < 9.75, 0.632 ≤ z < 0.716 (panel h)); 9.75 ≤ log M∗/M⊙ < 10, 0.632 ≤ z < 0.716 (panel i)); 10 ≤ log M∗/M⊙ < 10.25, 0.632 ≤ z < 0.716 (panel j)); 10.25 ≤ log M∗/M⊙ < 10.5, 0.632 ≤ z < 0.716 (panel k)); 10.5 ≤ log M∗/M⊙ < 10.75, 0.632 ≤ z < 0.716 (panel l)); 10.75 ≤ log M∗/M⊙ < 11, 0.632 ≤ z < 0.716 (panel m)); 11 ≤ log M∗/M⊙ < 11.25, 0.632 ≤ z < 0.716 (panel n)); 9.5 ≤ log M∗/M⊙ < 9.75, 0.716 ≤ z < 0.08 (panel o)); 9.75 ≤ log M∗/M⊙ < 10, 0.716 ≤ z < 0.08 (panel p)); 10 ≤ log M∗/M⊙ < 10.25, 0.716 ≤ z < 0.08 (panel q)); 10.25 ≤ log M∗/M⊙ < 10.5, 0.716 ≤ z < 0.08 (panel r)); 10.5 ≤ log M∗/M⊙ < 10.75, 0.716 ≤ z < 0.08 (panel s)); 10.75 ≤ log M∗/M⊙ < 11, 0.716 ≤ z < 0.08 (panel t)); 11 ≤ log M∗/M⊙ < 11.25, 0.716 ≤ z < 0.08 (panel u)); 9.5 ≤ log M∗/M⊙ < 9.75, 0.8 ≤ z ≤ 0.884 (panel v)); 9.75 ≤ log M∗/M⊙ < 10, 0.8 ≤ z ≤ 0.884 (panel w)); 10 ≤ log M∗/M⊙ < 10.25, 0.8 ≤ z ≤ 0.884 (panel x)); 10.25 ≤ log M∗/M⊙ < 10.5, 0.8 ≤ z ≤ 0.884 (panel y)); 10.5 ≤ log M∗/M⊙ < 10.75, 0.8 ≤ z ≤ 0.884 (panel z)); 10.75 ≤ log M∗/M⊙ < 11, 0.8 ≤ z ≤ 0.884 (panel a2)); 11 ≤ log M∗/M⊙ < 11.25, 0.8 ≤ z ≤ 0.884 (panel b2)). |
| Open with DEXTER | |
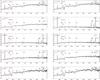 |
Fig. A.2
continued. |
| Open with DEXTER | |
For a fixed redshift, the stacked spectra – before stellar continuum subtraction – show a [OIII] line whose strength decreases with the progressive increase of the stellar mass (Fig. A.1), especially if compared with the Hβ line. The latter shows a weakening as well. The Hα line is very strong at low masses. The intensity of the [NII] and Hα decreases up to the point at the highest mass bin where these lines show the same intensity. In Fig. A.2, the [OIII] and Hβ lines show the same trend as at lower redshifts. The [OII] line intensity decreases with the increase of the mass, but it is always the strongest line in the high-redshift composite spectra.
Appendix B
We used the dust-corrected flux ratios for [OII]/Hβ instead of the EW ratios originally used by Lamareille (2010).
This appendix (Fig. B.1) shows that the dust-corrected fluxes correspond well enough to the EWs for a sample of SDSS galaxies (Vitale et al. 2012), especially in the regions occupied by our sample. Hence we can use the original demarcation lines from Lamareille (2010). However, the dust-corrected flux ratios span a slightly more restricted range of [OIII]/Hβ values than the EW ratios.
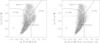 |
Fig. B.1
[OII] diagnostic diagram showing the consistency between EW measurements (left panel) and dust-corrected fluxes (right panel). The solid demarcation lines are taken from Lamareille (2010). The gray distribution represents the SDSS galaxies from Vitale et al. (2012). |
| Open with DEXTER | |
© ESO, 2013
Current usage metrics show cumulative count of Article Views (full-text article views including HTML views, PDF and ePub downloads, according to the available data) and Abstracts Views on Vision4Press platform.
Data correspond to usage on the plateform after 2015. The current usage metrics is available 48-96 hours after online publication and is updated daily on week days.
Initial download of the metrics may take a while.