| Issue |
A&A
Volume 555, July 2013
|
|
|---|---|---|
| Article Number | A110 | |
| Number of page(s) | 19 | |
| Section | Cosmology (including clusters of galaxies) | |
| DOI | https://doi.org/10.1051/0004-6361/201321267 | |
| Published online | 09 July 2013 | |
Online material
Appendix A: Optical counterparts of compact and diffuse sources
To identify optical counterparts for the compact and diffuse radio sources in the field, we overlaid 608 MHz contours on Isaac Newton Telescope (INT) optical images (Fig. A.1). The images are composites of Wide-Field Camera images taken in the B, V, R and I filters between October 1–8, 2009. The total integration times per filter is ~4000 s. The data were flat-fielded and bias-corrected with IRAF (Tody 1993) and the mscred package (Valdes 1998). The I and R band images were also fringe corrected. We removed cosmic rays and other artefacts by rejecting pixels above 3.0σrms.
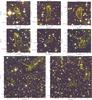 |
Fig. A.1
Optical images from the INT telescope. Contours from 608 MHz are overlaid at [4,8,16,32,64,128,256,512,1024] × σrms level. Sources are labelled as in Fig. 4. |
| Open with DEXTER | |
Appendix B: Spectral index and curvature errormaps
To evaluate the uncertainties in the pixel-by-pixel spectral index and spectral curvature values, we produced error maps. Values in Figs. B.1 and B.2 represent 1σ uncertainties in the spectral index as resulting from the linear fit of the logarithm of the flux measurements as function of log frequency.
In the fitting procedure, errors on the flux consisted of 10% absolute flux calibration added in quadrature to the rms noise. Figure B.3 presents the curvature uncertainty, which is the average of the errors in the high and low frequency spectral index fits (these are subtracted to obtain the curvature values).
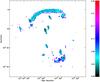 |
Fig. B.1
Spectral index error map corresponding to Fig. 14. Figures are in the same order. |
| Open with DEXTER | |
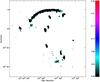 |
Fig. B.2
Spectral index error map corresponding to Fig. 15. |
| Open with DEXTER | |
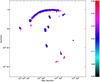 |
Fig. B.3
Spectral curvature error map corresponding to Fig. 16. |
| Open with DEXTER | |
© ESO, 2013
Current usage metrics show cumulative count of Article Views (full-text article views including HTML views, PDF and ePub downloads, according to the available data) and Abstracts Views on Vision4Press platform.
Data correspond to usage on the plateform after 2015. The current usage metrics is available 48-96 hours after online publication and is updated daily on week days.
Initial download of the metrics may take a while.