| Issue |
A&A
Volume 554, June 2013
|
|
|---|---|---|
| Article Number | A6 | |
| Number of page(s) | 16 | |
| Section | Interstellar and circumstellar matter | |
| DOI | https://doi.org/10.1051/0004-6361/201321081 | |
| Published online | 28 May 2013 | |
Online material
Appendix A: Cloud complexes at the edges of the Herschel maps
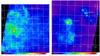 |
Fig. A.1
Right: Herschel/PACS 70 μm map (in Jy/px) of the G286.4−1.3 cloud complex. Left: Herschel/SPIRE 250 μm map (in Jy/beam) of the G289.0−0.3 cloud complex. |
| Open with DEXTER | |
In addition to the clouds associated to the Carina Nebula and the Gum 31 region, our Herschel maps also show several cloud structures at the periphery of the field of view. The two most prominent peripheral cloud complexes are seen near the south-eastern edge and the western edge of our map. Since no detailed FIR observations of these clouds seem to be available so far in the literature, we briefly describe the FIR morphology of these cloud complexes as revealed by our Herschel maps and discuss identifications with observations at other wavelengths.
Appendix A.1: The G289.0–0.3 cloud complex
A cloud complex extending over about 35′ × 35′ is seen around the position (αJ2000, δJ2000) = (10h56m30s, −60°06′00′′), near the south-eastern edge of our SPIRE maps. Optical images of this region show numerous field stars, but no prominent cloud features. The cloud complex we see in the Herschel maps is related to the radio-detected molecular cloud G289.0-0.3 described by Russeil & Castets (2004). With a radial velocity of vrad = + 27.5 km s-1, this cloud complex seems to be clearly unrelated to the Carina Nebula cloud complex (which has vrad ≈ −26 km s-1).
In addition to the diffuse cloud emission, our Herschel maps revealed 52 individual point-like sources, the positions and fluxes of which are given in Gaczkowski et al. (2013). Several of these can be identified with IRAS or MSX point-sources, some of which are marked in Fig. A.1. The brightest compact Herschel source in this area can be identified with the giant H II region PMN J1056-6005, which was detected in the Parkes-MIT-NRAO 4850 MHz survey (Griffith & Wright 1993), and seems to be identical to the H II region GAL 289.06-00.36 listed in Caswell & Haynes (1987). Cersosimo et al. (2009) detected emission in the H166α radio recombination line from this region and determined a distance of D = 7.1 ± 0.3 kpc. We note that this distance value is consistent with the prediction of the velocimetric model of the Galaxy by Vallée (2008) for the galactic longitude and the measured radial velocity of this molecular cloud complex.
At the southern tip of the cloud complex, the Be star CPD–59 2854 (=IRAS 10538-5958) is seen as a bright compact far-infrared source. In the northern part of this complex, one of the bright Herschel point-like sources is the extended 2MASS source 2MASX J10543287-5939178, which is listed as a Galaxy in the SIMBAD catalog, but may in fact be an ultra-compact H II region (Bronfman et al. 1996).
Since this cloud complex is located near the edge of our Herschel maps, and a considerable fraction is only covered by the SPIRE maps, but not by PACS, we cannot provide a complete characterization of this cloud complex. In our temperature map, the dust temperatures in these clouds ranges from about 18 K to about 25 K. Integrating our column density map (see Sect. 3) over a 16′ × 19′ area, covering that part of the cloud complex that is observed by PACS and SPIRE, we obtain a total mass of 65 000 M⊙. Due to the incomplete spatial coverage, this is clearly a lower limit to the total cloud mass of this complex.
This rather high cloud mass and the remarkably high number of detected point-like Herschel sources6 clearly show that this cloud complex is a region of active massive star formation that is worth to be studied in more detail.
Appendix A.2: The G286.4–1.3 cloud complex
Near the western edge of our PACS maps, a cloud complex extending over about 16′ × 19′ is seen around the position (αJ2000, δJ2000) = (10h34m00s, −59°47′00′′). Optical images of this region show several dark clouds.
The cloud complex seems to be related to the radio-detected molecular cloud G286.4-1.3 discussed by Russeil & Castets (2004). The radial velocity of vrad = + 39.9 km s-1 is clearly distinct from that of the Carina Nebula cloud complex (vrad ≈ −26 km s-1). We note that no CO emission from these clouds was detected in the survey of Yonekura et al. (2005).
In addition to the diffuse cloud emission, our Herschel maps revealed 15 individual point-like sources in these clouds, the positions and fluxes of which are given in Gaczkowski et al. (2013). The brightest emission peak in this complex can be identified with the ultra-compact H II region IRAS 10320-5928 (Bronfman et al. 1996).
The southern part of the cloud complex contains the FIR source IRAS 10317-5936, which is identified with the H II region GAL 286.42-01.48 and listed as part of the star-forming complex 286.4-01.4 in Russeil (2003). It contains the
two candidate massive YSOs 286.3938-01.3514 1 and 2 (Mottram et al. 2007). Fontani et al. (2005) determined a distance of D = 8.88 kpc to this cloud. We note that this distance value is consistent with the prediction of the velocimetric model of the Galaxy by Vallée (2008) for the galactic longitude and the measured radial velocity of this molecular cloud complex.
In the north-western part of this complex, another accumulation of compact clouds is found, two of which can be identified with IRAS sources.
The main part, but not the full extent of this cloud complex, is covered by our PACS and SPIRE maps. The dust temperatures range from about 20 K to ≳35 K. Integrating our column density map yields a total mass of ~93 000 M⊙ within a 16′ × 19′ area, if we assume the above-mentioned distance of 8.88 kpc. This is a strict lower limit, since our data cover only some part of the cloud complex.
This rather high cloud mass and the presence of numerous bright point-like Herschel sources (with fluxes up to ≈530 Jy, corresponding to FIR luminosities of up to ~25 000 L⊙) shows that this complex is a site of active massive star formation and certainly worth to be studied in more detail.
© ESO, 2013
Current usage metrics show cumulative count of Article Views (full-text article views including HTML views, PDF and ePub downloads, according to the available data) and Abstracts Views on Vision4Press platform.
Data correspond to usage on the plateform after 2015. The current usage metrics is available 48-96 hours after online publication and is updated daily on week days.
Initial download of the metrics may take a while.