| Issue |
A&A
Volume 550, February 2013
|
|
|---|---|---|
| Article Number | A20 | |
| Number of page(s) | 10 | |
| Section | Galactic structure, stellar clusters and populations | |
| DOI | https://doi.org/10.1051/0004-6361/201220674 | |
| Published online | 18 January 2013 | |
Online material
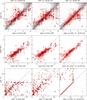 |
Fig. 6
M 31: age, mass, and extinction of 211 star clusters from (Vansevičius et al. 2009, as V09). Panels a), d), g) show results when a narrow extinction range of E(B − V) = [0.04,0.5] is allowed in the model grid, compared to V09 values. Panels b), e), h) show results for a wider allowed extinction range [0.04, 1.0], compared to V09 values. Panels c), f), i) compare results obtained in a wide extinction range vs. the ones obtained in a narrow extinction range. In panels a), b), c), a density map of Fig. 3d is reproduced to show regions of age-extinction degeneracy. Error bars are computed as described in Sect. 2. Six clusters from V09, which have E(B − V) > 1, are not shown in panels g) and h). Dashed ellipses, numbered “1”, “2”, and “3”, describe majority of associated clusters in the age and extinction panels. |
| Open with DEXTER | |
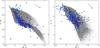 |
Fig. 7
M 33 galaxy star cluster sample of 161 objects from catalog of San Roman et al. (2010) (circles and stars) and the studied sample of 40 objects (stars) common to Ma (2012) and San Roman et al. (2009). Panels show a) U − B vs. B − V, and b) U − V vs. R − I diagrams. The model grid (without extinction) used to derive physical parameters of clusters is displayed in the background with indicated reddening vectors following the LMC extinction law. The continuous line traces PADOVA SSP of Z = 0.008. The B band magnitudes of clusters were shifted by 0.1 mag. |
| Open with DEXTER | |
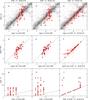 |
Fig. 8
M 33: age, mass and extinction of 40 star clusters common to catalogs of Ma (2012) and (San Roman et al. 2009, as S09). Panels a), d), g) show results when a narrow extinction range of E(B − V) = [0.04,0.3] is allowed in the model grid, compared to S09 values. Panels b), e), h) show results for a wider allowed extinction range of E(B − V) = [0.04,1.0], compared to S09 values. Panels c), f), i) compare results obtained in a wide extinction range vs. the ones obtained in a narrow extinction range. In panels a), b), c), a density map of Fig. 3d is reproduced to show regions of age-extinction degeneracy. Error-bars are computed as described in Sect. 2. |
| Open with DEXTER | |
© ESO, 2013
Current usage metrics show cumulative count of Article Views (full-text article views including HTML views, PDF and ePub downloads, according to the available data) and Abstracts Views on Vision4Press platform.
Data correspond to usage on the plateform after 2015. The current usage metrics is available 48-96 hours after online publication and is updated daily on week days.
Initial download of the metrics may take a while.