| Issue |
A&A
Volume 548, December 2012
|
|
|---|---|---|
| Article Number | A4 | |
| Number of page(s) | 34 | |
| Section | Extragalactic astronomy | |
| DOI | https://doi.org/10.1051/0004-6361/201219368 | |
| Published online | 13 November 2012 | |
Online material
Appendix A: Notes on individual LABOCA-COSMOS targets observed with the PdBI
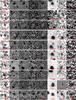 |
Fig. A.1
Optical to radio stamps for the LABOCA-COSMOS SMGs detected by PdBI. Names of sources with S/N > 4.5 in PdBI maps are underlined. |
| Open with DEXTER | |
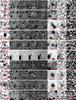 |
Fig. A.1
continued. |
| Open with DEXTER | |
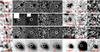 |
Fig. A.1
continued. |
| Open with DEXTER | |
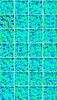 |
Fig. A.2
Cleaned PdBI maps (color scale), 30′′ on the side, with ± 2σ,3σ,... contours overlaid. Detections (identified in the dirty maps, see text for details) are marked by crosses. |
| Open with DEXTER | |
Here we present detailed notes on individual LABOCA-COSMOS (i.e. COSLA) SMGs observed with PdBI at 1.3 mm and ~1.5′′ resolution. We use a spectral index of 3, i.e. assuming Sν ∝ ν2 + β, where Sν is the flux density at frequency ν and β = 1 the dust emissivity index, to convert fluxes from/to various (sub-)mm wavelengths (if not stated otherwise).
COSLA-5
COSLA-5 is a S/N = 4.1 detection located at α = 10 00 59.521, δ = + 02 17 02.57. The PdBI-source is found at a separation of 3.4′′ from the LABOCA source center. The 1.3 mm flux density of the source is 2.04 ± 0.49 mJy. Scaling this to the MAMBO (1.2 mm) and LABOCA (870 μm) wavelengths we find 2.6 ± 0.6 and 6.9 ± 1.7 mJy, respectively. This is slightly lower than the extracted (and deboosted) MAMBO and LABOCA fluxes (4.78 ± 1, and 12.5 ± 2.6 mJy) and may indicate the presence of another mm-source, not detected in our PdBI map. Based on the rms reached in the PdBI observations, we can put a 3σ upper limit to this potential second source of 1.4 mJy.
The PdBI peak is 1.3′′ away from a source that is independently detected in the optical (i + = 22.5), UltraVista, and IRAC bands. The photometric redshift of this source is well constrained,  . Interestingly, at a separation of 1.1′′ towards the SW of the PdBI detection we find a faint source present only in the Ks band images, but not included in the catalogs (it is present in both the WIRCam and UltraVista images).
The mm-source is not associated with a radio detection suggesting a mm-to-radio flux based redshift for COSLA-5 of zmm/radio ≳ 3.8. Here we take the optical/IRAC/UltraVista source as the counterpart noting that given the ~4σ significance of the PdBI peak, and a separation of ≳1′′ from multi-wavelength sources, further follow-up is required to confirm this source and its redshift.
COSLA-6
Two significant (S/N > 4.5) sources are detected within the COSLA-6 PdBI map.
COSLA-6-N (S/N = 5.4, α = 10 01 23.64, δ = + 02 26 08.42) has a 230 GHz (1.3 mm) flux density of 2.7 ± 0.5 mJy. No IRAC/UltraVista source is found nearby. The closest source is a faint optical (no UltraVista/IRAC/radio) source 2.0′′ away. Given the high significance of the mm-detection the mm-positional accuracy is ~0.3′′. Thus, it seems unlikely that this optical source is the counterpart of the mm-detection. COSLA-6-N is however coincident with a 2.1σ peak in the radio map (F1.4 GHz = 19.5 ± 9.4 μJy). Based on this, we infer a mm-to-radio flux based redshift of  .
.
COSLA-6-S (S/N = 4.75, α = 10 01 23.57, δ = + 02 26 03.62) has a 1.3 mm flux density of 3.1 ± 0.6 mJy. It might be associated with a source detected in the optical (separation = 0.5′′; i + = 26.15), but not in near- or mid-IR. It is coincident with a 3.3σ peak in the radio map (F1.4 GHz = 33.3 ± 10.1 μJy). Based on the multi-wavelength photometry, we infer a photometric redshift of  for this source. A second potential redshift solution (although not as likely as the first one) exists at z ~ 4, and it is supported by the mm-to-radio flux based redshift,
  .
.
The combined 1.3 mm fluxes of COSLA-6-N and COSLA-6-S, scaled using a spectral index of 3, yield an expected flux density of 19.4 ± 2.7 mJy at 870 μm. This is in very good agreement with the deboosted LABOCA 870 μm flux of 16.0 ± 3.4.
COSLA-8
COSLA-8 is detected at S/N = 4.2, and located at α = 10 00 25.55, δ = +02 15 08.44. Its 1.3 mm flux density is F1.3 mm = 2.65 ± 0.62 mJy. Using a spectral index of 3 this extrapolates to an 870 μm flux density of 8.9 ± 2.1 mJy, in good agreement with the LABOCA deboosted flux of 6.9 ± 1.6 mJy. The source is located in a crowded region. A radio, IRAC, UltraVista detection is present at a separation of ~3′′, however the closest source to the mm-source (separation = 1.0′′) is detected only in the optical (i + = 27.4). A 3.3σ peak is found at the mm-position in the radio map (F1.4 GHz = 26.2 ± 8.0 μJy). The most probable photometric redshift for this source is  , however with a rather flat χ2 distribution as reflected in the uncertainties.
COSLA-9
We identify two 3.2σ peaks at α = 10 00 13.83, δ = + 01 56 38.64 (COSLA-9-S; 5.8′′ away from the LABOCA source center), and α = 10 00 13.75, δ = + 01 56 41.54 (COSLA-9-N; 7′′ away from the LABOCA source center). COSLA-9-S can be matched to an optical/IRAC/UltraVista source (i + = 24.8, separation = 0.8′′), while the closest source to COSLA-9-N is detected only in the optical (i + = 26.1; separation = 0.4′′) however it is only 1.3′′ away from an optical/UltraVista/IRAC source.
The primary beam corrected 1.3 mm flux densities of COSLA-9-N and COSLA-9-S are 1.69 ± 0.47 mJy, and 1.87 ± 0.58 mJy, respectively. Added together, and scaled to the LABOCA (13.2 ± 2.1 mJy) and AzTEC (6.3 ± 1.0 mJy) frequencies yields a good match to the deboosted LABOCA (14.4 ± 3.3 mJy) and AzTEC (8.7 ± 1.1 mJy) fluxes. Given the low significance of the sources, further follow-up is required to confirm their reality.
COSLA-10
No significant source is present in the 1.3 mm map. The statistical counterpart association (see Sect. 5.2.1 and Fig. 4 for details) suggests three separate potential (tentative) counterparts to this LABOCA source. The sum of the extracted 1.3 mm fluxes (taken as maximum flux within a circular area of 1′′ in radius centered at the statistical counterpart), corrected for the primary beam response, is 2.43 mJy. This yields a flux of 8.1 mJy when scaled to 870 μm, in very good agreement with the LABOCA flux of 7.3 ± 1.7 mJy (see Fig. 2). This suggests that the LABOCA source may be fainter at 1.3 mm than can be detected given our PdBI sensitivity and that it possibly breaks up into multiple components when observed at 1.5′′ resolution.
COSLA-11
The brightest peaks in the PdBI map are at 3.5σ (COSLA-11-N) and 3σ (COSLA-11-S).
COSLA-11-N is located at α = 10 01 14.260, δ = 01 48 18.86, and it can be associated with a faint optical detection 0.64′′ away (i + = 27.75). Its 1.3 mm flux density is F1.3 mm = 2.15 ± 0.62 mJy, and the source is not detected in the radio map. Based on the multi-wavelength photometry of the counterpart of COSLA-11-N, we find a photometric redshift of  . The mm-to-radio based redshift however suggests zmm/radio ≳ 3.6.
COSLA-11-S (α = 10 01 14.200, δ = + 01 48 10.31) is only 2.6′′ away from the center of the LABOCA source, and it coincides (separation = 0.5′′) with independent optical and UltraVista H-band, and UltraVista J-band detections. Although fairly low S/N, the UltraVista detection increases the probability that it is a real source. Its 1.3 mm flux density is F1.3 mm = 1.43 ± 0.48 mJy. Our photometric redshift estimate yields two, almost equally probable, redshifts at z ~ 0.2 and z ~ 3. Given that the SMG is not detected in the radio map, the higher redshift solution, also consistent with the mm-to-radio flux ratio based redshift (zmm/radio ≳ 3), is more likely. We thus adopt the higher redshift solution for this source yielding  (where the errors reflect the 99% confidence interval derived using only z > 1.5 χ2 values).
The combined flux densities of the two detections, scaled to 870 μm, yield a flux density of 12.0 ± 2.6 mJy at this wavelength. This is in good agreement with the LABOCA 870 μm flux density of 19.4 ± 4.5 mJy, and thus further affirms the reality of the sources.
COSLA-12
No significant source is present in the 1.3 mm map. The statistical counterpart association (see Sect. 5.2.1 and Fig. 4 for details) suggests two separate potential (one robust and one tentative) counterparts to this LABOCA source. The sum of the extracted 1.3 mm fluxes (taken as the maximum flux within a circular area of 1′′ in radius centered at the statistical counterpart), corrected for the primary beam response, is 2.68 mJy. Scaled to 870 μm this implies a flux of 8.9 mJy which is lower than the LABOCA flux of 18.3 ± 4.2 mJy (see Fig. 2). This suggests that the LABOCA source may be fainter at 1.3 mm than can be detected given our PdBI sensitivity and/or it breaks up into multiple components when observed at 1.5′′ resolution.
COSLA-13
COSLA-13 is detected at S/N = 3.9 (α = 10 00 31.840, δ = +02 12 42.81). Its 1.3 mm flux density is F1.3 mm = 1.37 ± 0.61 mJy. This SMG is detected within the LABOCA (870 μm), AzTEC (1.1 mm), and MAMBO (1.2 mm) surveys. Scaling the PdBI 1.3 mm flux to 870 μm, 1.1 mm, 1.2 mm (using a slope of 4.6 which corresponds to the mean slope between the AzTEC/LABOCA and AzTEC/MAMBO detected fluxes) we find flux densities of 8.8 ± 3.9 mJy (870 μm), 2.9 ± 1.3 mJy (1.1 mm), and 2.0 ± 0.9 mJy (1.2 mm). These are consistent with the AzTEC/LABOCA fluxes, and slightly lower than the MAMBO flux (note that we find consistent results when using a slope with a spectral index of 3).
The PdBI mm-source is coincident with an optical/UltraVista/IRAC/radio source (separation = 0.55′′) with an optical spectrum at redshift zspec = 2.175.
COSLA-14
No significant source is present in the 1.3 mm map. The statistical counterpart association (see Sect. 5.2.1 and Fig. 4 for details) suggests one robust statistical counterpart to this LABOCA source. The extracted 1.3 mm flux (taken as maximum flux within a circular area of 1′′ in radius centered at the statistical counterpart), corrected for the primary beam response, is 1.64 mJy. The scaled 870 μm flux of 5.5 mJy is fairly consistent with the LABOCA flux of 9.0 ± 2.1 mJy when scaled to 870 μm (see Fig. 2). This suggests that the LABOCA source may be fainter at 1.3 mm than can be detected given our PdBI sensitivity.
COSLA-16
A significant extended source is found ~3.5′′ away from the LABOCA source center. It is best fit by a double-Gaussian (using the AIPS task jmfit and fixing the width of the Gaussians), yielding two sources located at α = 10 00 51.5854, δ = + 02 33 33.5648 (COSLA-16-N) and α = 10 00 51.5541, δ = + 02 33 32.0948 (COSLA-16-S). The 2-Gaussian fit yields 1.3 mm flux densities of F1.3 mm = 1.39 ± 0.32 mJy (COSLA-16-N) and F1.3 mm = 1.19 ± 0.33 mJy (COSLA-16-S).
COSLA-16-N can be associated with an optical/UltraVista/ IRAC/radio source (separation = 0.79′′). COSLA-16-S is not associated with a separate source in the multi-wavelength catalogs. The radio emission associated with the position of COSLA-16-N is significant (F1.4 GHz = 95.6 ± 10.1 μJy), while a 3.3σ peak, that seems to be the extension of the significant radio source, is associated with COSLA-16-S (F1.4 GHz = 33.3 ± 10.1 μJy). The multi-wavelength photometry of COSLA-16-N implies a photometric redshift of  . The mm-to-radio based redshift inferred for COSLA-16-S is
  , suggesting it is associated with COSLA-16-N.
Photometry table for our LABOCA SMGs with PdBI detections.
A third 3.9σ peak (COSLA-16-E) with 1.3 mm flux density of F1.3 mm = 2.26 ± 0.58 mJy is found 6′′ east of the LABOCA source center and it is coincident with a faint optical source (separation = 0.41′′, i + = 29.20). Our photometric redshift computation yields s redshift of  , however (as also reflected in the error) the χ2 distribution is fairly flat below z ≲ 4 thus making all redshifts below z ~ 4 almost equally probable. The mm-to-radio flux based redsfhit suggests zmm/radio ≥ 3.7.
The combined 1.3 mm flux density of the 3 identified sources, scaled to 870 μm yields 16.3 ± 2.5 mJy, in very good agreement with the deboosted LABOCA flux (14.0 ± 3.6 mJy).
COSLA-17
Two significant S/N > 4.5 detections are found within the PdBI map.
COSLA-17-S is detected at high significance (S/N = 5.3; α = 10 01 36.772, δ = + 02 11 04.87). Its 1.3 mm flux density is F1.3 mm = 3.0 ± 0.6 mJy, and it can be associated with a faint source 0.23′′ away with mNB816 = 26.2. No IR or radio source is associated with this detection. We find a photometric redshift for this source of  , while the mm-to-radio based redshift suggests zmm/radio ≳ 4.
COSLA-17-N is found at S/N = 4.6 (α = 10 01 36.811, δ = + 02 11 09.66) with a 1.3 mm flux density of F1.3 mm = 3.55 ± 0.677 mJy. It is perfectly coincident with an optical/UltraVista/IRAC/radio source (separation = 0.09′′), however it is within the sidelobe region of the brighter COSLA-17-S source. Hence further follow-up with more complete uv-coverage is required to affirm this source. We find a photometric redshift of  , consistent with the mm-to-radio based redshift of
  .
.
This SMG is detected by both LABOCA and AzTEC/ASTE surveys, and the flux ratio using these two surveys suggests a spectral index of 2.08. Using this value to scale the combined 1.3 mm PdBI fluxes to 870 μm (1.1 mm) we find a flux density of 15.2 ± 2.2 mJy (9.2 ± 1.4 mJy), consistent with the deboosted LABOCA (AzTEC/ASTE) flux of 12.5 ± 3.2 mJy ( mJy).
mJy).
COSLA-18
COSLA-18 is detected at S/N = 4.5 (α = 10 00 43.19, δ = + 02 05 19.17). Its 1.3 mm flux density is F1.3 mm = 2.15 ± 0.48 mJy. Scaled to 870 μm (1.1 mm) this yields a flux density of 7.2 ± 1.6 mJy (3.5 ± 0.8 mJy), consistent with the deboosted LABOCA (AzTEC/ASTE) fluxes of 10.0 ± 2.6 mJy ( mJy). The source is coincident with an optical/UltraVista/IRAC/radio source (separation = 0.67′′; i + = 28.96). Our photometric redshift computation yields 2 almost equally probable photometric redshifts at z ~ 3 and z ~ 5. The significant radio detection (F1.4 GHz = 60.1 ± 8.9 μJy) would argue in favor of the lower redshift solution, consistent with the mm-to-radio flux based redshift of
  . Thus, here we adopt the low-redshift solution for this source, yielding
  , noting that a second solution of
  is possible.
COSLA-19
Cosla-19 is detected at S/N = 4.1 with a 1.3 mm flux density of 3.17 ± 0.76 mJy. Scaling this flux to 1.2 mm, 1.1 mm, and 870 μJy yields fluxes of 4.1 ± 1.0 mJy, 5.1 ± 1.2 mJy, 10.7 ± 2.6 mJy, respectively, consistent with the deduced MAMBO, AzTEC, and LABOCA fluxes of 5.55 ± 0.9 mJy,  mJy, and 7.4 ± 1.8 mJy, respectively. The closest multi-wavelength source to Cosla-19 is an optical/UltraVista source 2.0′′ away (i + = 25.66). Such a separation makes it unlikely that this source is the counterpart of the mm-detection although given the mm-resolution and significance a ~0.8′′ positional uncertainty is expected. A 2σ = 16.1 μJy radio peak is associated with the PdBI mm peak yielding a mm-to-radio-flux ratio based redshift for Cosla-19 of
  .
.
COSLA-23
Within the COSLA-23 LABOCA beam two significant (S/N > 5) sources are found in the PdBI 1.3 mm map. COSLA-23-N is detected at S/N = 7.3 at α = 10 00 10.161, δ = + 02 13 34.95. It is coincident with an optical/UltraVista/IRAC/radio source (separation = 0.44′′; i + = 26.3). COSLA-23-S is detected at S/N = 6.2 at α = 10 00 10.070, δ = + 02 13 26.87. It can be matched to an optical/IRAC source (separation = 0.87′′, i + = 28.49), but it is not detected in the radio map. Based on the multi-wavelength photometry of the counterparts we find photometric redshifts of  (COSLA-23-N) and
  (COSLA-23-S).
The 1.3 mm flux densities for COSLA-23-N and COSLA-23-S are 3.42 ± 0.47 mJy, and 3.70 ± 0.60 mJy, respectively. Only COSLA-23-N is within the MAMBO 11′′ beam, and the scaled 1.3 mm flux (4.4 ± 0.6 mJy) agrees well with the COSBO-2 flux (5.77 ± 0.9 mJy).
COSLA-25
No significant source is present in the 1.3 mm map. No statistical counterpart could be associated with this SMG. Therefore, it remains unclear whether the LABOCA source is spurious, breaks up into multiple components at 1.5′′ angular resolution, or simply is below the PdBI detection limit.
COSLA-30
No significant source is present in the 1.3 mm map. No statistical counterpart could be associated with this SMG. Therefore, it remains unclear whether the LABOCA source is spurious, breaks up into multiple components at 1.5′′ angular resolution, or simply is below the PdBI detection limit.
COSLA-33
The most prominent feature in the PdBI map within the LABOCA beam is a 3.1σ peak 6.0′′ away from the LABOCA source center that can be associated with an optical/ UltraVista/IRAC source (i + = 25.2, separation = 0.95′′). Its 1.3 mm flux density is 1.78 ± 0.58 mJy which scales to 6.02 ± 1.95 mJy at 870 μm, in good agreement with the deboosted LABOCA flux (6.8 ± 1.1 mJy). Given the low significance of the 1.3 mm source further follow-up is required to affirm its reality.
COSLA-35
COSLA-35 is detected at a signal-to-noise of S/N = 4.2 (α = 10 00 23.65, δ = + 02 21 55.22). Its 1.3 mm flux density is F1.3 mm = 2.15 ± 0.51 mJy. This flux scaled to 870 μm (1.1 mm) yields a flux density of 7.3 ± 1.7 mJy (3.5 ± 0.8 mJy), consistent with the observed LABOCA (AzTEC/ASTE) fluxes of 8.2 ± 1.1 mJy ( mJy). The mm-detection is coincident with an optical/UltraVista/IRAC/radio source (separation = 0.55′′; i + = 27.24). We find a photometric redshift of
  .
.
COSLA-38
COSLA-38 is detected at S/N = 4.4 at α = 10 00 12.59, δ = + 02 14 44.31, 14.8′′ away from the LABOCA source position (thus essentially outside the LABOCA beam; FWHM = 27′′). It is however only 0.67′′ away from the MAMBO source Cosbo-19, and coincident with a radio/UltraVista/IRAC/optical source (separation = 0.23′′, i + = 24.08). We infer a 1.3 mm flux density of F1.3 mm = 8.19 ± 1.85 mJy, which should however be treated with caution as the correction for the primary beam response at that distance from the PdBI phase center applied to the flux is about a factor of 4. We find a photometric redshift of  for this SMG.
COSLA-40
COSLA-40 is detected at S/N = 3.4 (α = 09 59 25.91, δ = + 02 19 56.40), 11.3′′ away from the LABOCA source center. Its 1.3 mm flux density is F1.3 mm = 3.41 ± 1.02 mJy. Scaling this flux to 870 μm yields a flux density of 11.5 ± 3.4 mJy, in very good agreement with the deboosted LABOCA flux (F870 μm = 11.1 ± 3.4 mJy). The source is coincident with an optical source (separation = 0.51′′; i + = 25.52), but not detected in the radio. Given the expected flux density, and the coincidence of the source with an optical detection we assume this source to be real. We find a photometric redshift of  , but we note that χ2 dips are also found at lower and higher redshift values, and that the mm-to-radio flux based redshift suggests zmm/radio ≳ 4.5.
COSLA-47
COSLA-47 is detected at α = 10 00 33.350, δ = + 02 26 01.66 and S/N = 5.3, 6.4′′ away from the LABOCA source center. Its 1.3 mm flux density is 3.11 ± 0.59 mJy, and consistent with the LABOCA/AzTEC fluxes, when scaled to these frequencies. The PdBI source is coincident (separation = 0.48′′) with a source independently detected at optical, IR, and radio wavelengths. We find a well constrained photometric redshift of  .
.
Within the LABOCA beam several more S/N > 4 peaks can be associated with optical/UltraVista/IRAC sources. They are however within sidelobe contaminated regions. This LABOCA SMG may be a blend of several sources, but further follow-up is required to confirm this.
COSLA-48
No significant source is present in the 1.3 mm map. The statistical counterpart association (see Sect. 5.2.1 and Fig. 4 for details) suggests two potential tentative counterparts to this LABOCA source. The sum of the extracted 1.3 mm fluxes (taken as maximum flux within a circular area of 1′′ in radius centered at the statistical counterpart), corrected for the primary beam response, is 1.56 mJy. This flux, scaled to 870 μm (5.2 mJy) is in very good agreement with the LABOCA flux of 6.1 ± 1.7 mJy (see Fig. 2). This suggests that the LABOCA source may be fainter at 1.3 mm than can be detected given our PdBI sensitivity and it breaks up into multiple components when observed at 1.5” resolution.
COSLA-50
No significant source is present in the 1.3 mm map. The statistical counterpart association (see Sect. 5.2.1 and Fig. 4 for details) suggests two potential (robust and tentative) counterparts to this LABOCA source. The sum of the extracted 1.3 mm fluxes (taken as maximum flux within a circular area of 1′′ in radius centered at the statistical counterpart), corrected for the primary beam response, is 2.61 mJy. When scaled to 870 μm this flux (8.7 mJy) is fairly consistent with the LABOCA flux of 5.6 ± 1.6 mJy (see Fig. 2). This suggests that the LABOCA source may be fainter at 1.3 mm than can be detected given our PdBI sensitivity and it breaks up into multiple components when observed at 1.5′′ resolution.
COSLA-51
No significant source is present in the 1.3 mm map. The statistical counterpart association (see Sect. 5.2.1 and Fig. 4 for details) suggests one robust potential counterpart to this LABOCA source. The extracted 1.3 mm flux (taken as maximum flux within a circular area of 1′′ in radius centered at the statistical counterpart), corrected for the primary beam response, is 1.27 mJy, consistent with the LABOCA flux of 6.2 ± 1.7 mJy when scaled to 870 μm (4.5 mJy; see Fig. 2). This suggests that the LABOCA source is fainter at 1.3 mm than can be detected given our PdBI sensitivity and/or it breaks up into multiple components when observed at 1.5′′ resolution.
COSLA-54
COSLA-54 is detected at S/N = 5.0 (α = 09 58 37.99, δ = + 02 14 08.52), 7.6′′ away from the LABOCA source center. Its 1.3 mm flux density is F1.3 mm = 3.26 ± 0.65 mJy. Scaling this flux to 870 μm (1.1 mm) yields a flux density of 11.0 ± 2.2 mJy (5.3 ± 1.1 mJy), in agreement with the deboosted LABOCA (AzTEC/ASTE) flux of 11.6 ± 4.1 mJy ( mJy). The mm-detection can be associated with an optical/IRAC/radio source (separation = 0.75′′; i + = 25.21). We find a photometric redshift of
  .
.
COSLA-62
No significant source is present in the 1.3 mm map. No statistical counterpart could be associated with this SMG. Therefore, it remains unclear whether the LABOCA source is spurious, breaks up into multiple components at 1.5′′ angular resolution, or simply is below the PdBI detection limit.
COSLA-128
COSLA-128 is detected at S/N = 4.8 (α = 10 01 37.99, δ = + 02 23 26.50). Its 1.3 mm flux density is F1.3 mm = 4.50 ± 0.94 mJy. Scaling this flux to 870 μm (1.1 mm) yields a flux density of 15.2 ± 3.2 mJy (7.3 ± 1.5 mJy), in agreement with the LABOCA (AzTEC/ASTE) flux of 11.0 ± 3.5 mJy (4.4 ± 1.1 mJy). The source is coincident with an optical detection (no MIR/radio; separation = 0.55′′; i + = 26.57). We find a photometric redshift of  , with secondary and tertiary possible solutions at z ~ 1.2, and z ~ 3.
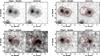 |
Fig. B.1
Deblending of AzTEC-8 in Spitzer/IRAC bands. |
| Open with DEXTER | |
COSLA-161
COSLA-161 is detected at S/N = 3.5 (α = 10 00 16.150, δ = + 02 12 38.27). Its 1.3 mm flux density is F1.3 mm = 2.54 ± 0.674 mJy. Scaling this flux to 870 μm, 1.1 mm, and 1.2 mm, using a spectral index of 3, yields 10.1 ± 4.8, 4.1 ± 1.2, and 3.3 ± 0.9 mJy, respectively. This is in very good agreement with the deboosted LABOCA (10.1 ± 4.8mJy), AzTEC/ASTE (3.2 ± 1.1 mJy), and MAMBO fluxes (1.4 ± 0.9 mJy).
The SMG is coincident with an optical/IR/radio source with an available (VIMOS/IMACS) spectrum at zspec = 0.187. The source is also detected by Chandra in the X-rays, and we find a 0.5–2 keV band flux of 1.9 ± 0.8 erg s-1 cm-2. At a redshift of 0.187 this corresponds to a bolometric X-ray luminosity (0.1–10 keV) of (6.2 ± 2.8) × 1040 erg s-1 (assuming a power law spectral shape with photon index 1.8). Given this X-ray luminosity it is not clear whether it arises from star-formation processes or a low-power AGN.
It is interesting that a second radio source is present within the LABOCA beam (zspec = 2.947), and is not associated with mm-emission (however there is a 2.3σ peak at its position in the PdBI map).
Appendix B: Notes on the 1.1 mm-selected sample
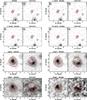 |
Fig. B.2
Deblending of AzTEC-11-N in UltraVista YJHK and Spitzer/IRAC bands. |
| Open with DEXTER | |
Our 1.1 mm-selected sample is based on the SMA follow-up of 15 brightest SMGs drawn from the 1.1 mm AzTEC/JCMT-COSMOS survey at 18′′ angular resolution (AzTEC-1 to AzTEC-15; see Table 1; Younger et al. 2007, 2009). Detailed notes on individual targets are given in Younger et al. (2007, 2009). Here we have extracted the multi-wavelength photometry, tabulated in Table B.1, for the counterparts of these SMGs using the deep COSMOS multi-wavelength catalog, with UltraVista data added. The photometry in the IRAC bands had to be deblended for AzTEC-8 (see Fig. B.1), and that for AzTEC-10 had to specifically be extracted as this source was not present in the catalog (see Younger et al. 2009). The photometry extraction and deblending were performed following the procedure described in detail by Smolčić et al. (2012). Furthermore, AzTEC-11 is a peculiar source that required particular attention. Younger et al. (2009) find that the SMA detection is best fit by a double Gaussian, suggesting a multiple component (N & S) source, labeled AzTEC-11-N and AzTEC-11-S19. They present three positions for this SMG: i) AzTEC-11 when the SMA detection is fit using a single-Gaussian, and ii) AzTEC-11-N and AzTEC-11-S when the SMA detection is fit using a double Gaussian. AzTEC-11 is coincident with an optical/MIR/radio source with a spectroscopic redshift (zspec = 1.599). AzTEC-11-S (which is actually the northern component of the source) cannot be matched to a multi-wavelength counterpart in the deep COSMOS maps. Thus, given the rms in the 20 cm VLA-COSMOS survey we estimate a mm-to-radio based redshift of zmm/radio > 2.58. AzTEC-11-N (which is actually the southern component of the source) has an independent UltraVista and IRAC counterpart. To extract its photometry we have deblended the counterpart of AzTEC-11-N by subtracting a 2D-Gaussian from the maps at the position of the counterpart of AzTEC-11, In Fig. B.2 we show the deblended maps for AzTEC-11-N. We find a photometric redshift of  for this component.
Photometry table for our 1.1 mm-selected sample.
© ESO, 2012
Current usage metrics show cumulative count of Article Views (full-text article views including HTML views, PDF and ePub downloads, according to the available data) and Abstracts Views on Vision4Press platform.
Data correspond to usage on the plateform after 2015. The current usage metrics is available 48-96 hours after online publication and is updated daily on week days.
Initial download of the metrics may take a while.