| Issue |
A&A
Volume 546, October 2012
|
|
|---|---|---|
| Article Number | A87 | |
| Number of page(s) | 31 | |
| Section | Interstellar and circumstellar matter | |
| DOI | https://doi.org/10.1051/0004-6361/201219803 | |
| Published online | 11 October 2012 | |
Online material
Appendix A: SMA spectra and tables
XCLASS fit results from SMA for NGC 6334I.
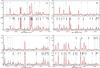 |
Fig. A.1
LSB Spectra (in steps of 500 MHz) of the two hot cores SMA1 (upper) and SMA2 (lower) of NGC 6334I, observed with the Submillimeter Array. Overlaid in red are the XCLASS fits. For more detailed information about each identified spectral line, see Table A.2. |
| Open with DEXTER | |
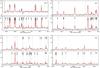 |
Fig. A.1
continued. |
| Open with DEXTER | |
List of identified lines in the SMA bands of NGC 6334I in order of increasing rest frequency.
Appendix B: HIFI fitted curves of all molecules
Examples of selected, fitted spectra for each molecule. In red is the model, in blue are mostly annotations or blended lines. If only few transitions of a molecule are present, they are all shown in the plot. For weeds or molecules with many lines, no quantum numbers are given and only selected frequency ranges over different bands are presented. Heavy blended lines are excluded for simplicity. All intensities are given in units of Kelvin. The quantum numbers refer to upper state – lower state. For absorption lines, this sequence should be read reversed.
The entire observed and simulated spectrum for each HIFI band will be made available online in the CLASS format on the CHESS website (http://www-laog.obs.ujf-grenoble.fr/heberges/hs3f/), as soon as the HIPE 8 reprocessed data are available. Additionally, the modeled spectrum for each molecule (including isotopologues and vibrationally excited states) can be loaded. It should be noticed that for the simulated spectrum of only one molecule, the blending by other molecules is not taken into account. This results in a deviation for the fits of absorption lines when a nearby emission line contributes to the continuum. In XCLASS, at first all the emission components are calculated and then the absorption components.
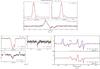 |
Fig. B.1
XCLASS fits of chemical species in the HIFI spectrum of NGC 6334I. |
| Open with DEXTER | |
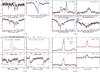 |
Fig. B.1
continued. |
| Open with DEXTER | |
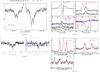 |
Fig. B.1
continued. |
| Open with DEXTER | |
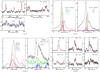 |
Fig. B.1
continued. |
| Open with DEXTER | |
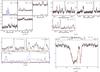 |
Fig. B.1
continued. |
| Open with DEXTER | |
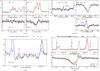 |
Fig. B.1
continued. |
| Open with DEXTER | |
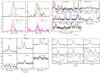 |
Fig. B.2
XCLASS fits of chemical species in the HIFI spectrum of NGC 6334I. continued. |
| Open with DEXTER | |
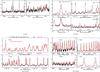 |
Fig. B.2
continued. |
| Open with DEXTER | |
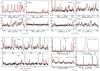 |
Fig. B.2
continued. |
| Open with DEXTER | |
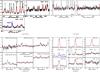 |
Fig. B.2
continued. |
| Open with DEXTER | |
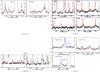 |
Fig. B.2
continued. |
| Open with DEXTER | |
© ESO, 2012
Current usage metrics show cumulative count of Article Views (full-text article views including HTML views, PDF and ePub downloads, according to the available data) and Abstracts Views on Vision4Press platform.
Data correspond to usage on the plateform after 2015. The current usage metrics is available 48-96 hours after online publication and is updated daily on week days.
Initial download of the metrics may take a while.