| Issue |
A&A
Volume 546, October 2012
|
|
|---|---|---|
| Article Number | A105 | |
| Number of page(s) | 24 | |
| Section | Stellar atmospheres | |
| DOI | https://doi.org/10.1051/0004-6361/201117166 | |
| Published online | 16 October 2012 | |
Online material
Appendix A: Introduction to the figures
Associated with the tables referred to as Table Axx, resp. Bxx, that are available at the sites mentioned in Sect. 1 of the main paper, we give the three figures mentioned in Tables A.9 and B.2.
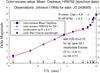 |
Fig. A.1
The color-excess ratio of HR 8752, recalculated for synchronicity of MK-type, is given as function of 1/λ, with the plot for the mean of 6 stars in Cepheus from Johnson (1968) as comparison, leading to an redetermination of the R-ratio R. We estimate for HR 8752 an R = 4.4 with an accuracy of + −0.2 in analogy with Johnson’s determination of the the R-value at 1/λ = 0 for the “mean”. With E(B − V) = 0.70 the absorption in the V color is Av = 3.08. |
| Open with DEXTER | |
Figure A.1 gives the colour-excess ratio of HR 8752, recalculated for synchronicity of MK-type as a function of 1/λ, after Johnson (1968), together with the mean for 6 stars in Cepheus (from Johnson 1968) as comparison. The data is given in Table A.9, where the above figure is mentioned as Fig. A.9.1.
Figure A.2 gives the temperature calibration for hypergiants, using observational data (Teff from De Jager 2001), as a function of s-parameter (De Jager & Nieuwenhuijzen 1987).
Figure A.3 compares the calibration with the two spectral class relations for Ia and Ia+. The data is associated with Table B.2, where the above figures are mentioned as Figs. B.2.1 and B.2.2, respectively. In De Jager & Nieuwenhuijzen (1987), the spectral class Ia+ is represented by b-parameter b = 0.0, class Ia by b-parameter b = 0.6.
The calibration line coincides with the Ia and Ia+ lines at high temperature (low value of s), then after s = 2, it stays close
to the Ia line, between s = 3.5–5, it stays close to Ia+, and then it stays close to the Ia line around s = 6.8 (with μ Cep). For practical purposes we limit the fit to the observational s-range of s = 2.6–7.0. The resulting temperature calibration is valid within the limited spectral range of B8 - M2.
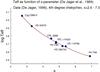 |
Fig. A.2
The continuous line gives the calibration of hypergiant temperatures based on observational data (Teff from De Jager 2001), as a function of s-parameter (De Jager & Nieuwenhuijzen 1987). |
| Open with DEXTER | |
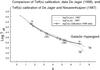 |
Fig. A.3
The calibration as given in Fig. A.2 is compared with earlier calibration of Teff as a function of s-parameter, and shows it’s position between spectral class Ia and Ia+ (De Jager & Nieuwenhuijzen 1987). |
| Open with DEXTER | |
© ESO, 2012
Current usage metrics show cumulative count of Article Views (full-text article views including HTML views, PDF and ePub downloads, according to the available data) and Abstracts Views on Vision4Press platform.
Data correspond to usage on the plateform after 2015. The current usage metrics is available 48-96 hours after online publication and is updated daily on week days.
Initial download of the metrics may take a while.