| Issue |
A&A
Volume 543, July 2012
|
|
|---|---|---|
| Article Number | A59 | |
| Number of page(s) | 21 | |
| Section | Interstellar and circumstellar matter | |
| DOI | https://doi.org/10.1051/0004-6361/201219110 | |
| Published online | 27 June 2012 | |
Online material
Appendix A: Tables with photometry and SEDs
Ultraviolet, optical and near-IR photometry.
Mid-infrared photometry.
Sub-mm and mm photometry for a sub-sample of stars.
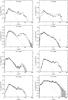 |
Fig. A.1
SEDs of the stars in the sample. Triangles are photometric upper limits. For each panel, the best fit is the black-solid line and the models fitting with |
| Open with DEXTER | |

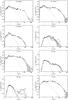 |
Fig. A.1
continued. |
| Open with DEXTER | |
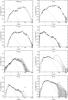 |
Fig. A.1
continued. |
| Open with DEXTER | |
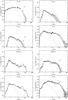 |
Fig. A.1
continued. |
| Open with DEXTER | |
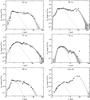 |
Fig. A.1
continued. |
| Open with DEXTER | |
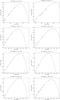 |
Fig. A.2
Subsample of stars with fluxes available at λ ≥ 0.35 mm (log ν [GHz] ≤ 2.9, see Table A.3). The best graybody fits yielding the indicated values for tD and β are shown. Fluxes at λ ≤ 2.0 mm (log ν [GHz] ≥ 2.1) are weighted stronger in the fits. |
| Open with DEXTER | |
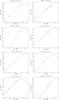 |
Fig. A.2
continued. |
| Open with DEXTER | |
© ESO, 2012
Current usage metrics show cumulative count of Article Views (full-text article views including HTML views, PDF and ePub downloads, according to the available data) and Abstracts Views on Vision4Press platform.
Data correspond to usage on the plateform after 2015. The current usage metrics is available 48-96 hours after online publication and is updated daily on week days.
Initial download of the metrics may take a while.