| Issue |
A&A
Volume 543, July 2012
|
|
|---|---|---|
| Article Number | A131 | |
| Number of page(s) | 18 | |
| Section | Extragalactic astronomy | |
| DOI | https://doi.org/10.1051/0004-6361/201118589 | |
| Published online | 11 July 2012 | |
Online material
Appendix A: Morphology of NGC 1316
 |
Fig. A.1
Our R-image of NGC 1316. The size is 36′ × 36′. North is up, east to the left. One notes the relatively well-defined outer border. The diameter along the major axis is 24.5′, along the minor axis 21.5′. The intensity levels are displayed logarithmically. Almost all faint structures are already visible on the photographic image of Schweizer (1980) except for the very faint arc that appears as a continuation of the plume reaching out to the NW. The faint larger-scale structures in the upper part are probably flat-field structures. There is scattered light into the camera at the lower right edge, coming from the V = 7.7 mag star HD 20914. The border of the globular cluster system corresponds well to the visible luminous body. |
| Open with DEXTER | |
The morphology of NGC 1316 has been discussed several times (e.g. Schweizer 1980; Mackie & Fabbiano 1998), but to our knowledge, a wide-field deep CCD image of NGC 1316 does not exist in the literature. Moreover, the color map of the inner region exhibits details that are worth to be shown.
A.1. Global morphology
A deep wide-field image of NGC 1316 reveals a wealth of faint structures. We here focus on GCs, but it is appropriate to make a few remarks on the global morphology. Schweizer (1980) gave a thorough morphological description of the NGC 1316 complex on a scale of about 1 degree. For orientation and labels of the various features, we refer the reader to Fig. 2 of Schweizer (1980).
It is interesting to see that our deep CCD-image (Fig. A.1) is not much superior to photographic Schmidt plates regarding the detection of faint areal structures. In Fig. A.1 almost all features labeled by Schweizer are visible. There are only two structures that we do not share. One is the very faint arc to the SE (Schweizer’s Fig. 9), which is outside our field. The other is an extremely faint curved arc (resembling a “spiral arm”) that appears as a continuation of the L1 structure reaching out to the NW. Regarding this feature, one may think of the “rows” in grand design spiral galaxies where parts of spiral arms are straight lines rather than curved. This has not been discussed much in the literature. Chernin (1998) gave a gas dynamical interpretation, but encounters may also play a role.
For example, the structure of the grand design spiral M 51 has been analyzed by Dobbs et al. (2010) through hydrodynamical models. They identified tidal influences (in the case of M 51 the interaction with NGC 5195) as a main driver for shaping spiral structure. In analogy, NGC 1316 could have interacted with its companion NGC 1317 or with a subsequently merged galaxy.
Intuitively, the region outside the bulge gives the impression of an inclined disk rotating clockwise. Practically all loops are consistent with this sense of rotation except the outermost loop in the SW. However, a bulge component kinematically dominates outside 35′′ (Bedregal et al. 2006).
Very noticable is the sharp border in the south. This may be another hint that we are looking onto a (thick?) disk since three-dimensional structures in projection should not be so sharply confined.
The distribution of GCs is well-confined to the luminous area seen in Fig. A.1. We emphasize the morphological similarity of NGC 1316 with NGC 474/470. Sikkema et al. (2006) presented V − I photometry of its GCS and only found a broad blue peak, similar to our entire sample.
A.2. The surface brightness profile
Owing to the inner saturated region, we can measure the surface brightness profile of NGC 1316 in the R-band on our MOSAIC image only from about 50′′ outward. To enable the comparison with published aperture photometry, we used the ellipse-task in IRAF to measure (almost) circular “isophotes” and tried to find an analytic spherical model for the surface brightness. We integrated this radial model and calculated aperture photometric values, which we compared with the compilation of aperture photometries of Prugniel & Heraudeau (1998). For the model, we chose a “beta-model”, which worked surprisingly well. The exponent of −1 enables deprojection and integrated mass to be written analytically (which here would result in only approximate values, since the system is not spherical, e.g. see Schuberth et al. 2010; Richtler et al. 2011).  (A.1)with a1 = 3.902 × 10⁻⁷, Rc = 8′′, α = −1.0. To transform this surface brightness into L⊙/pc2, one has to apply a factor 2.56 × 10¹⁰ to the argument of the logarithm (where we used MR, ⊙ = 4.45). The foreground extinction in the R-band is 0.056 mag (Schlegel et al. 1998), which we neglected.
Figure A.2 shows in its upper panel the beta-model (solid line), the spherical model (open circles), and measurements of elliptical isophotes (ellipticity 0.3, position angle 50°). These measurements were shifted by 0.5 mag to enhance the visibility. In the spherical model, the bulge does not emerge as a separate entity, because the sphericity introduces some smoothing. We compared our model with published aperture photometry (Prugniel & Heraudeau 1998) by integrating within given apertures. The result is shown in Fig. A.3 for eight apertures and is found to be very satisfactory.
Characteristic values of the spherical photometric model.
Table A.1 lists the absolute R-magnitudes and corresponding luminosities for the bulge and the total extension of NGC 1316. The effective radius is 69.5′′, corresponding to almost exactly 6 kpc.
A.3. Color image
The color image is restricted in size because of the strong flat-field features present on the western part of the C-image.
Figure A.4 displays the color in magnitudes. Its size is 23.3′ × 14.5′. After subtracting the sky, we divided the C-image by the R-image and converted the resulting image to a magnitude scale.
 |
Fig. A.2
Upper panel: our surface-brightness profile in the R-band. The solid line is the beta-model. Open circles denote the surface brightness with spherical isophotes. Open triangles denote the surface brightness with elliptical isophotes (ellipticity 0.3, position angle 50°). This profile was shifted by −0.5 mag for better visibility. Lower panel: residuals in mag between our measurements (upper panel) and the photometric model in the sense: observations-model. |
| Open with DEXTER | |
 |
Fig. A.3
Model of our surface-brightness profile reproducing published R-band aperture photometries excellently. x-axis shows aperture radii, the y-axis the apparent R magnitude. Open circles are from the compilation of Prugniel & Heraudeau (1998), squares are simulated aperture photometries of our beta-model. |
| Open with DEXTER | |
We selected from the GC photometry 10 of the brightest non-saturated objects at small radii and applied their calibrated magnitudes to the galaxy light to make sure that the galaxy colors are measured differentially to the GC colors. The resulting scatter is 0.03 mag in C − R. The dynamical range of Fig. A.4 covers the color interval 1.3–1.9, which was found to be the most satisfactory. Dark is blue and bright is red. The magnitude scale itself is displayed logarithmically. Owing to the uncertain flat-field of the C-image at low intensity levels, the colors beyond about 8′ are not reliable. We are particularly reluctant to claim the reality of the outer red structures in the north, but mention that on Schweizer’s plate (his Fig. 1) the northern extension of NGC 1316 appears more diffuse than the southern border.
 |
Fig. A.4
Color image of NGC 1316. See text for details. |
| Open with DEXTER | |
The extended line emission region of Mackie & Fabbiano (1998) is visible as the bright spot, presumably dust, in the south just above the CCD-gap, which unfortunately covers part of the structure. The southern HII-region, detected by Schweizer (1980), appears as a dark spot not well visible in this display. It is an extremely interesting object, apparently showing globular cluster formation under quite isolated conditions. We intend to dedicate a contribution to this object alone.
A.4. The color profile
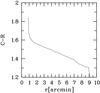 |
Fig. A.5
Radial color profile. The color was measured along the major axis of NGC 1316 averaging along elliptical isophotes with a position angle of 50°. |
| Open with DEXTER | |
The color map does not exhibit a clear elliptical appearance. Despite this, we adopted the ellipticity of the optical isophotes and evaluated the color by averaging along “color-isophotes” with a fixed ellipticity of 0.3 and a position angle of 50°, corresponding to the major axis of NGC 1316. Figure A.5 shows the radial dependence of color. The inner jump to very red colors is due to the central dust structures. The gradient was noted already by Schweizer (1980), who attributed it to a declining abundance in the outer parts. The question whether age or abundance is the dominant factor, must be left for future investigations of the outer clusters.
A.5. Color image of the central parts
 |
Fig. A.6
Inner part of NGC 1316 showing the C − R color map. The size is 7.8′ × 6.5′. Red is bright, blue is dark. The dynamical range is 1.5 < C − R < 1.7, so also tiny color differences become visible. See text for details. |
| Open with DEXTER | |
The wealth of structure and features that is visible in the inner color map deserves a special description. The basis is Fig. A.6. This map displays C − R in the range from 1.5 to 1.7. White is red, dark is blue. The reddest colors are caused by dust, while bluer colors are caused by bluer stellar populations and/or perhaps by strong emission of the OII-3727 line, which falls into the C-filter. The inner dust features best known from HST images appear white with a color of about C − R = 1.9. They fit well to non-stellar PAH emission (Temi et al. 2005; Kaneda et al. 2007). Note that the overall symmetry of the dust distribution differs from the spheroid. It shows a slightly elliptical distribution with its major axis at a PA of about −30°.
Note the many tiny dust patches in the north, which are absent in the south. Remarkable is the slightly curved brighter feature, beginning at about 2.5′ to the north, the PA first being 70° and 90° on its eastern part. The overall impression is that of a relic of a spiral arm, which may be a direct clue to the nature of the original galaxy. At its southern border, it is accompanied by a more blueish color, recalling that dust usually follows trailing spiral arms.
One of the most conspicuous features is Schweizer’s “plume”, pointing toward the NW. Neither Schweizer nor Mackie & Fabbiano (1998) detected line emission. No atomic or molecular gas has been detected (Horellou et al. 2001). Dust also seems to be absent. Its total extent in the NW-direction is almost 2′, corresponding to 10 kpc. One finds the bluest color at the “head” in some blue spots which have C − R = 1.1. Toward the SE, the color becomes somewhat redder, typically 1.4. Since we observe in projection, this does not mean that the color of the associated stellar population is really varying, but only that its density varies. The true color might be quite blue and homogenous. Unless this population has a low metallicity (an infalling dwarf galaxy in tidal dissolution cannot be excluded), it must be younger than 1 Gyr. Graham (1987) made the interesting suggestion that the plume might represent young stars whose formation was triggered by a nuclear jet. A correspondence might be seen in a group of blue stars in CenA that has its probable origin in star formation triggered by the X-ray jet (Graham & Fassett 2002). However, its major axis points neither to the nucleus nor to the center of the western inner radio lobe (which is not necessarily a counterargument after roughly a crossing time). The alternative (also mentioned by Graham 1987) is an infalling dwarf galaxy in dissolution, which appears to be more probable.
Striking is also the psi-shaped irregular structure 1′ to the south, which is bluer than its environment by 0.05 mag, which to our knowledge has not yet been mentioned in the literature. Whether the color is caused by a bluer population or due to line emission, must be cleared up by spectroscopy.
© ESO, 2012
Current usage metrics show cumulative count of Article Views (full-text article views including HTML views, PDF and ePub downloads, according to the available data) and Abstracts Views on Vision4Press platform.
Data correspond to usage on the plateform after 2015. The current usage metrics is available 48-96 hours after online publication and is updated daily on week days.
Initial download of the metrics may take a while.