| Issue |
A&A
Volume 542, June 2012
GREAT: early science results
|
|
|---|---|---|
| Article Number | L4 | |
| Number of page(s) | 13 | |
| Section | Letters | |
| DOI | https://doi.org/10.1051/0004-6361/201218925 | |
| Published online | 10 May 2012 | |
Online material
Appendix A: Atmospheric calibration of heterodyne astronomical observations
This appendix is a complete compilation of the calibration scheme for astronomical observations with a heterodyne receiver, taking into account the special problems that appear at highest frequencies, i.e., at the edge or beyond the validity of the common Rayleigh-Jeans (R-J) approximation, where the R-J correction across the receiver input band has to be taken into account with the high IF-bandwidths in use at present instruments. It also describes a general scheme for incorporating the correction for atmospheric transmission, which for observations at high altitudes from the ground, but in particular from air-borne or balloon-borne altitudes requires a detailed treatment of the spectrally narrow atmospheric features.
The terminology follows, to the extent possible, the notation defined in Kutner & Ulich (1981) and Downes (1989).
A.1. Specific intensity and equivalent brightness temperature
The specific intensity Iν is expressed as an antenna brightness temperature TA,ν in the usual radio-astronomical notation,  (A.1)For a black-body radiation field with a physical temperature T,
  (A.2)the brightness temperature is thus
  (A.3)Note that expansion in
  gives
gives  . The difference between two black-bodies at temperatures T2 and T1 thus is
  (A.4)With
  , the correction term for a frequency of ν = 2 THz and temperatures of 300 K and 77 K hence is δ = −0.066, small but still significant, whereas at 345 GHz it would only be δ = −0.0019.
Another quantity of interest is the ratio of black-body intensities between the image- and signal-sideband. With νi = νs ± νIF, we obtain  (A.5)which, for ν = 2 THz, νIF = 4 GHz and a representative low temperature of 77 K gives an upper-/lower-sideband ratio of 1.0035, i.e. within 0.35% of unity.
A.2. Antenna temperatures
We consider the general case of a heterodyne mixer that is sensitive in both sidebands and looks out to the sky, which emits an intensity equivalent to an antenna temperature TA,sky,ν, partially picks up intensity from ambient material with a physical temperature Tamb, and possibly has a sideband filter that is terminated at a physical temperature of Tterm. The mixer then sees in a narrow frequency band, centered at a signal sideband frequency νs and an image sideband frequency νi, a total intensity of  (A.6)where we have introduced the following definitions:
 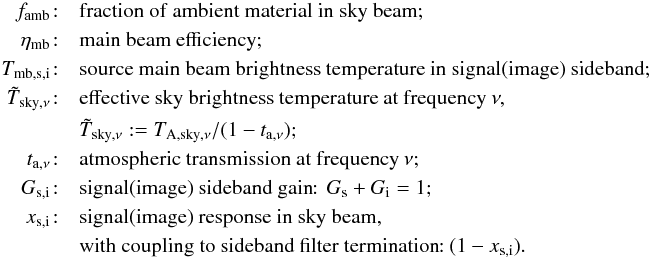 (A.7)Here, we have assumed that the coupling factor to ambient and the main beam efficiency are independent of the reception sideband.
A.3. Types of receivers
We can distinguish the following two cases straightforwardly:
-
case A: a receiver with no sideband filter has
 (A.8)GREAT on SOFIA falls into this category.
 -
case B: a receiver with a sideband filter, i.e., non-zero coupling to the sideband termination, has
 (A.9)
(A.9)
A.4. Main-beam brightness temperature and forward beam brightness temperature
In the above, we have expressed the source signal as a main-beam brightness temperature, i.e., as the convolution of the source brightness distribution on the sky with the main-beam profile of the telescope. The coupling of the detector to the telescope main beam is the main-beam efficiency ηmb. This is appropriate if the telescope has a clean main beam, thus avoiding additional pick-up of source intensity in side-lobes (error-beam pickup). This is also a good description if the source is compact so that it has only intensity within the main beam.
Alternatively, the source signal can be expressed as a forward beam brightness temperature  , i.e., as the convolution of the source brightness with the full forward antenna response. The relevant coupling efficiency is then the forward efficiency ηfwd, which in the above nomenclature is ηfwd = 1 − famb. The term ηmb TMB,ν then is replaced by
  .
.
A.5. Sky brightness and opacity
A.5.1. Opacity
The sky transmission along a line-of-sight at elevation El for a plane-parallel atmosphere, i.e., approximating the airmass by A = 1/sin(El) (the latter assumption being valid except at extremely low elevations), is  (A.10)is given by the zenith opacity τν, where we drop the index Z in the following.
The zenith-opacity of a particular species ξ is the integral along the line-of-sight from the observers altitude h to space over the abundance of that species times its absorption coefficient. The abundance at altitude s is expressed as the volume-mixing ratio  (A.11)relative to the total density n(s) (we closely follow the nomenclature of the AM handbook, Paine 2011). The general expression for the opacity of a particular atmospheric species ξ with number density nξ(s) = xξ(s) n(s) is then the line-of-sight integral over the product of its abundance times its pressure-, P(s) , and temperature-, T(s), -dependent molecular absorption coefficient,
  (A.12)The total opacity is obtained by summation over all species,
  (A.13)The details of the microphysics, i.e., the kind of absorption (single line transitions, CIA, etc.) are contained in the molecular absorption coefficients. For CIA the coefficient is proportional to the the abundance of the collision partner(s)
  , i.e.,
  (A.14)which for self-broadening (
 ) leads to a quadratic dependence on the abundance of the species.
Instead of altitude, the equivalent pressure can be used to specify the height in the atmosphere (pressure altitude) through the hydrostatic equation  (A.15)with the mean molecular weight mair of the atmosphere and the gravitational acceleration g.
We will show below that the zenith opacity of the atmosphere above the observer can be separated into a wet and a dry part (where the dry part may contain opacity from the high water column in the stratosphere with constant volume mixing ratio that does not change with local humidity and daily weather). Thus, the opacity can be written as  (A.16)
A.5.2. Sky brightness
The sky brightness is the integral along the line-of-sight at elevation El over the source function times the attenuation, which for a plane-parallel layering, approximating the airmass as A = 1/sin(El), reads  (A.17)From this, the effective sky brightness as defined in Eq. (A.7) can be calculated with a given line-of-sight transmission ta,ν as
  (A.18)
A.6. Parameterization of the atmospheric water vapor
For water, a reasonable altitude distribution in the stratosphere and upper troposphere is given by a low, constant mixing ratio, dominant in the upper stratosphere, plus an exponential term, extending through the upper troposphere and lower stratosphere (Mastenbrook 1968; Herbin et al. 2009). We thus write  (A.19)with
  . The typical value for xc is 2.5 × 10⁻⁶ (Mastenbrook 1968; Herbin et al. 2009); hc or
  can be adjusted to match the desired column of water vapor above the observer. Equation (A.19) gives a total column density of water above altitude h of
  (A.20)using the abbreviations
 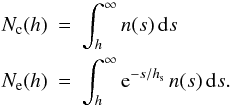 (A.21)The minimum column is given by the constant volume mixing ratio, setting
  (A.22)Hence,
  (A.23)Similarly, using the abbreviations
 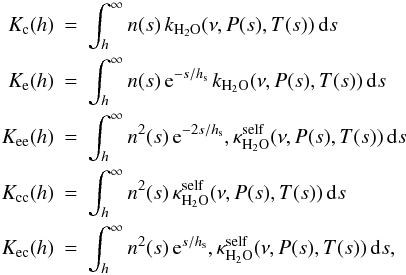 (A.24)the water opacity is
  (A.25)Note that in this notation, the absorption coefficient of water includes the contributions from CIA-processes due to collisions with other species,
  (A.26)The self-broadening contribution for water in the thin, upper atmosphere can be neglected (Bauer et al. 1987, 1989). Combining the opacity contribution from the constant volume-mixing ratio part of water, τc,ν(h) = xc Kc(h), with the opacity of all other species into
  (A.27)we can write the zenith opacity as separated into a dry opacity, resulting from all absorption from species other than water, but including the constant mixing ratio contribution from water in the upper stratosphere, and a wet opacity, which increases in proportion with the pwv from the exponential part of the water vapor above the observer,
  (A.28)Hence, we obtain Eq. (A.16) with
  (A.29)
A.6.1. Alternative parameterization of the atmospheric water vapor
Equation (A.19) is a rather ad hoc parameterization, which approximates the water abundance altitude profile above the SOFIA flight altitudes. An alternative parameterization, which is actually the one used in the present implementation with the kalibrate task in the kosma_software package, would be as follows:  (A.30)This gives, using Ne(h) and Nc(h) as defined in Eq. (A.21) above
  (A.31)
As in the case above, he can be varied to scale the water profile to the desired total column of water above the observer. Owing to the different parameterization, the variation of NH2O(h) with he is now a more complex dependence and solving for he is not possible analytically. The minimum column of water above the observer is now given by the contribution with the constant volume mixing ratio when he = h, namely
  (A.32)identical to the case above. Similarly, and again neglecting the self-broadening contributions of water, the water opacity is now given by
  (A.33)For small increases above the minimum, i.e. he = h + ϵ, we have
 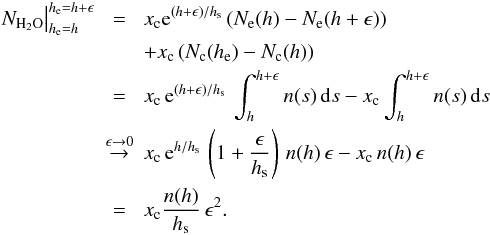 (A.34)For the water opacity we obtain, following Eq. (A.30), and abbreviating k(s) = kH2O(ν,P(s),T(s)),
 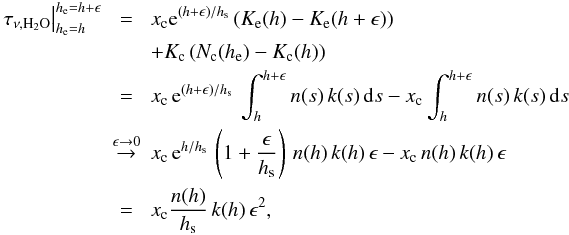 (A.35)so that the opacity is proportional to pwv, with
  (A.36)For larger water columns, the opacity is not necessarily proportional to pwv: although the Ne-, resp. Kc-, contribution in Eqs. (A.34) and (A.35) becomes rapidly insignificant relative to the first terms because of the exponential decrease with increasing he: the variation of the altitude distribution due to the changing point of intersection between the constant and exponential part, he, results in changing line profiles in the first terms. However, as long as the variation of the line profile with altitude is relatively slow, i.e. kν(s) ≈ kν(h), we approximately have
  (A.37)so that the proportionality between opacity and water column holds again, with Eq. (A.36) holding approximately.
A.7. Spectrometer response and gain profile
The spectrometer detects in each frequency channel (we omit the index specifying the spectrometer channel, resp. intermediate frequency, νIF, in the following) a count rate (counts/sec) C proportional to the radiation input plus the receiver noise (expressed as an equivalent brightness temperature at the receiver input, Trec), the total being  (A.38)Additionally, depending on the detailed detection mechanism of the power in the spectrometer channels, the receiver may have a count-offset Z, i.e., a non-zero count rate at zero (IF-) input power. The detected count rate is thus
  (A.39)so that the spectrometer gain γ (gain profile, if specified as a function of frequency) determines the response of the receiver for any difference measurement:
  (A.40)
A.8. Gain calibration: Hot- and cold-load measurements
For calibration measurements on the hot- or cold-load, the mixer sees  (A.41)where we have used the abbreviation
  (A.42)With the known physical temperatures of the loads, and the known sideband gains and sideband filter coupling coefficients, the spectrometer gain in each spectral resolution element can be measured from the difference in count rates between the hot- and cold-load measurement:
  (A.43)As discussed above, the difference between signal- and image-sideband brightness temperatures may be neglected to relative high precision, resulting in
  , where an obviously consistent choice for the frequency at which to evaluate the brightnesses would be
  .
.
A.9. Sky transmission calibration
The sky transmission is derived from measurements on the blank sky (either explicit sky-measurements, or the off-source positions of an astronomical observation). The measured difference between sky- and hot-load measurement gives  (A.44)(note that here and in the following, the cold-load measurement and temperatures may be used instead of the hot-load). This is compared with the theoretical expression for the brightness difference, which, using Eqs. (A.6) and (A.41), gives
 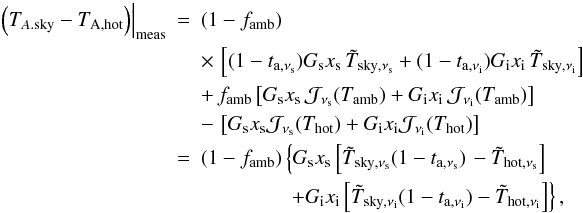 (A.45)where we have used the abbreviation for the effective hot-temperature
  (A.46)Introducing the additional approximations
  (A.47)

 gives
gives 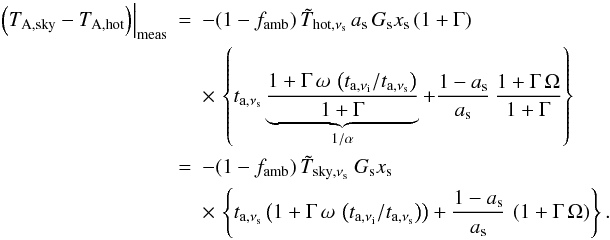 (A.48)As discussed above, ω ≈ 1 to high precision for the relevant range of frequencies and temperatures. Ω ≈ 1 only holds as long as the effective sky brightness is close to a black-body function, i.e.,
  , with a frequency-independent effective physical sky temperature Tsky. This is not necessarily the case: a narrow-line absorption in the signal band resulting from water at the low temperatures of the upper troposphere and a similarly narrow feature from a high-altitude dry species at the higher physical temperature of the upper stratosphere may have very different effective sky temperatures, following their definitions according to Eqs. (A.17) and (A.18).
Assuming for simplicity Ω = 1 and ω = 1, and considering a DSB receiver with equal gain in both sidebands and no sideband filter, i.e., Γ = 1, xs = 1 and Gs = 1, we obtain the simple formula  (A.49)For a single-sideband receiver, i.e., Gi = 0, and hence Γ = 0, xs = 1 and Gs = 1, we obtain
  (A.50)The latter can be immediately inverted to calculate the sky transmission in the signal band; in the former case, only the average transmission in the signal- and image-sideband can be determined.
The same holds for the general case of Eq. (A.48), which gives  (A.51)from which the sky transmission in the signal-sideband alone can be determined only with additional knowledge on i) the ratio of signal- and image-sideband transmission, and ii) the effective sky brightness at the signal- and image-band frequency,
  , which is also needed to calculated Ω with full precision.
Determining the transmission across the spectrometer channel by channel is not the best strategy, because the values derived would be very noisy due to the relatively low S/N per spectrometer channel. This can be improved by using broader frequency averages, but at the cost of loosing the information of variations of the atmospheric absorption with frequency on frequency scales below the averaging interval.
To overcome the difficulty of the unknown atmospheric transmission ratio between image- and signal-sideband, one has to use additional knowledge about the atmosphere by applying an atmospheric model and fitting the observed sky-hot brightness to the model-predicted one.
This is implemented in the KOSMA-observing software package kosma_software in the task kalibrate as follows: (i) the first step is to identify and discard “bad” channels, e.g., at the band edges without significant IF-response and saturated channels etc.; (ii) the observed and calibrated sky-hot difference across the reception bandwidth of the receiver is then fitted with the atmospheric model prediction, following Eq. (A.48), using the pwv as a free parameter; the implementation at present makes the simplifying assumption of ω = 1 and Ω = 1. The best-fit value is thus determined with high precision, making use of the full spectral information observed, i.e., with a good S/N. The user can control whether the fit is performed as a “common” fit to all simultaneously observed spectra (several receiver pixels at several frequency bands) or individually for each spectrometer; (iii) the measured on-off source spectrum can then be calibrated on the main-beam brightness temperature scale via  (A.52)This is made separately for each spectrometer channel, thus applying the frequency dependence of the atmospheric transmission as specified by the atmospheric model to the data.
A.10. Determination of receiver noise and system temperature
Equations (A.38) and (A.39) define the system temperature used for proper noise-weighting of the data when averaging, and the receiver temperature that needs to be optimized when tuning the receiver, both on a TA scale, however. Comparison with Eq. (A.41) shows that the system temperature and receiver temperature referred to an equivalent black-body with physical temperature Tsys,phys, resp. Trec,phys at the receiver input, either DSB or single-sideband, is  (A.53)respectively
  (A.54)From the defining Eq. (A.39), we obtain for the hot- and cold-load measurement
  (A.55)and can derive (Y-factor method)
  (A.56)Solving for Trec gives
  (A.57)so that
  (A.58)Ignoring the difference in brightness between the signal- and image-sideband on the hot- and cold load,
  reduces to the standard formula for the receiver temperature in the Y-factor method,
  (A.59)The additional term on the right-hand-side corrects for the coupling to the image-sideband termination in the sideband filter and reduces to 0 with xs = xi = 1.
We obtain for the system temperature (on the off-source position on the sky)  (A.60)Insertingly, we obtain from Eq. (A.48)
  (A.61)and Tsys,DSB or Tsys,SSB following Eq. (A.54).
© ESO, 2012
Current usage metrics show cumulative count of Article Views (full-text article views including HTML views, PDF and ePub downloads, according to the available data) and Abstracts Views on Vision4Press platform.
Data correspond to usage on the plateform after 2015. The current usage metrics is available 48-96 hours after online publication and is updated daily on week days.
Initial download of the metrics may take a while.


