| Issue |
A&A
Volume 541, May 2012
|
|
|---|---|---|
| Article Number | A145 | |
| Number of page(s) | 36 | |
| Section | Stellar structure and evolution | |
| DOI | https://doi.org/10.1051/0004-6361/201117472 | |
| Published online | 17 May 2012 | |
Online material
Appendix A: Summary of historical data for Galactic BHGs
In order to understand the role of the BHG phase in the lifecycles of massive stars it is invaluable to contrast the long term (in)stability of such stars to other, potentially related evolutionary phases such as the LBVs. In order to accomplish this we undertook a literature review of all known Galactic examples. This has allowed the construction of the comprehensive spectroscopic and photometric datasets used in the quantitative modeling descibed in Sect. 4. To the best of our knowledge there are 16 known or candidate BHGs within the Galaxy, of which 8 have early (B1-4) spectral types. In constructing this list we have explicitly included 3 high luminosity stars of late-B spectral type which, although classified as luminosity class Iae, have prominent Balmer emission lines that appear characteristic of bona fide BHGs.
A.1. The early-B HGs: Cyg OB2 #12
A.1.1. Photometric variability
Gottlieb & Liller (1978) provide an extensive optical photometric history for Cyg OB2 #12, comprising, where available, annual mean B band magnitudes from ~1890–1980. They report low level annual variability (mB ~ 14.5−15.0 mag.) albeit with no apparent secular evolution. Despite being somewhat limited, the compilation of multi-epoch UBVRIJHK photometry presented in Table A.1 is consistent with little photometric activity being present9.
While systematic photometric monitoring of Cyg OB2 #12 ceased after 1980 – fortuitously at a point when spectroscopic observations increased in frequency (Sect. A.1.2) – two further long-term photometric datasets are available. The first, acquired via the Hipparcos mission (ESA 1997; Perryman et al. 1997), provides data from 1989 November to 1993 March, with the passband, Hp, spanning 3400–9000 Å (van Leeuwen et al. 1997). Subsequently, the Northern Sky Variability Survey (NSVS; Woźniak et al. 2004) yielded a further year long dataset (1999 April–March 2000); this operated without filters, resulting in a wide optical band with a response defined by that of the CCD, extending from 450 to 1000 nm.
These data are summarised in Fig. 3 and although the non-standard passbands do not allow a direct comparison to previous data they do constrain variability over the periods in question. As with the results of Gottlieb & Liller (1978), these datasets indicate that low level (~0.3 mag) non secular and aperiodic variability is present, which occurs over rather short (~days) timescales.
While only single epoch mid-IR observations are available (Table A.2), multiple epochs of radio continuum observations are available in the literature, and are summarised in Table A.3. While the spectral indices derived from these data are consistent with thermal emission from a partially optically thick stellar wind, these fluxes demonstrate significant variability. As with the short period photometric variability, a possible interpretation of this behaviour is provided in Sect. 3.
A.1.2. Spectral classification and variability
A summary of the multiwavelength spectroscopy obtained for Cyg OB2 #12 over the past half century is presented in Table A.4. The spectral classifications given are those reported by the works in question; reclassification is provided only for those occasions where the source papers assumed an earlier result (this being the case for the IR studies, where Cyg OB2 #12 was typically included as a spectral standard). Regarding reclassification, a luminosity class of Ia+ is implictly assumed throughout the following discussion.
4–6000 Å:
Souza & Lutz (1980), Massey & Thompson (1991), Klochkova & Chentsov, (2004) and Kiminiki et al. (2007) all provide a detailed discussion of the classification of Cyg OB2 #12 from 4000–5000 Å spectra at high resolution and S/N, using the He i 4471 Å:Mg ii 4481 Å line ratio as the primary spectral-classification criterion. Following this methodology, spectral types in the range B3–B8 have been inferred by these authors, with variability in the line ratio (e.g. Kiminiki et al. 2007) taken as evidence for changes in the spectral type of Cyg OB2 #12.
However, we caution that extreme care must be taken in inferring changes in the physical properties of the star from this diagnostic. Firstly, the Mg ii 4481 Å transition shows a dependence on stellar luminosity and so callibrations of spectral type versus the He i 4471 Å:Mg ii 4481 Å line ratio derived from lower luminosity stars may not a priori be directly applied to Cyg OB2 #12. More critically and as demonstrated in Sect. 4.1, this ratio is highly sensitive to the properties of the photosphere/wind transitional zone. Consequently, changes in the structure of the inner wind – which we may infer from line profile variability in Hα (see below) – at constant stellar temperature will cause this line ratio to vary, and in turn lead to the erroneous conclusion that because the spectral type has varied then the temperature has also changed.
Given the quality of their spectra – and in conjunction with data presented in Walborn & Fitzpatrick (1990) – Kiminki et al. (2007) also employed the weak absorption feature at ~ 4542 Å as a classification criterion, which they attributed to a blend of He ii and Fe ii. While an absorption feature at ~ 4542 Å is observed in B1.5–4 supergiants, it is unlikely to be due to He ii (seen only for B0 and earlier supergiants) or Fe ii (B5 and later). Given these uncertainties, we instead choose to employ the Si iii 4552 Å/Si ii 4128 Å line ratio as a primary temperature diagnostic. Thus, upon consideration of the above, we suggest a spectral classification of B5 for the 1992 July 22 spectrum and B4 for the 1998 August, 2000 September and 2008 July spectra (Fig. A.1), noting that the marginally later classification in 1992 is likely to be a result of the lower S/N and spectral resolution of these data. We thus find no evidence for changes in the spectral type of Cyg OB2 #12 in these data.
6–8000 Å:
the spectral region surrounding Hα is largely devoid of classification criteria (e.g. Negueruela et al. 2010). However (i) the strong central Hα emission peak superimposed on broad emission wings; (ii) lack of He ii 6527, 6683 Å absorption; (iii) absence of S iv 6668, 6701 Å emission; and (iv) the presence of strong C ii 6578, 6582 Å photospheric lines are uniformly present in spectra from 1992 onwards10 and are all consistent with a highly luminous B supergiant (Fig. 1). As found by Klochkova & Chentsov (2004), the central peak of the Hα profile appears to be variable at low projected velocities ( ≤ 140 km s-1).
8–9000 Å:
despite spanning a period of over 16 years, the 3 I band spectra are essentially identical (a representative spectrum from 2008 is presented in Fig. A.2). To classify Cyg OB2 #12 from these data we employed the scheme described in Negueruela et al. (2010), supplemented by spectra of other early-mid BSGs and BHGs of known spectral type. While the BHG spectra show a similar morphological progression to those of normal BSGs (Negueruela et al. 2010, Fig. A.2), there is no indication of emission in the Paschen series (noting that the lower Balmer transitions are seen in emission). While such a finding precludes the separation of BHGs from BSGs in the spectroscopic window in which GAIA – the Global Astrometric Interferometer for Astrophysics – will operate, the lack of wind contamination aids in the quantitative determination of the underlying stellar parameters (Sect. 4).
Regarding the classification of Cyg OB2 #12, the presence of N i absorption lines indicates a spectral type of B3 or later, with their comparative weakness favouring B3. This finding is consistent with both the strength of the O i 8446 Å line, which clearly lies between B2.5Ia and B4Ia (see Fig. A.2), and the temperature sensitive Pa15/Pa11 and Pa16/Pa11 line ratios. However, the differences between B3 and B4 Ia stars are small – hence we suspect that the slight discrepancies between classifications based on the ~ 4–5000 Å and ~ 8–9000 Å windows evident for data obtained in 1992 and 2008 are unlikely to be real. Likewise, distinguishing between B5 and B8 supergiants on the basis of I band spectra alone is particularly difficult (Negueruela et al. 2010); hence we caution against using the results of Sharpless (1957) and Zappala (1970) as evidence for spectroscopic variability prior to 1970. Echoing Sect. 4, changes in the physical properties of the photosphere/wind transitional zone have negligible impact on the I band spectral morphology – hence explaining potential discrepancies between the spectral type of Cyg OB2 #12 determined from the I band and the He i 4471 Å:Mg ii 4481 Å diagnostic.
0.98–1.10 μm:
two epochs of observations from 1990 and 1992 are presented by Conti & Howarth (1999), who report no variability between the spectra. Unfortunately a paucity of spectral features and little calibration data complicate classification from these data, although the presence of weak He i 1.031 μm suggests a classification of B8 Ia+ or earlier and the absence of He ii 1.0124 μm provides an upper limit of B3 Ia+. Such a result is consistent with that derived from our spectra obtained on 1992 July 22.
1.66–1.72 μm:
a single epoch of H band spectroscopy was presented by Hanson et al. (1998), with Br11 and He i 1.700 μm lines in absorption and of ~ equal strength and He ii 1.693 μm absent. The lack of He ii 1.693 μm is characteristic of a B spectral type, with EW(Br11) ≥ EW(He i) occuring for B1.5 Ia+ and later (at the resln. of the spectrum in question) and only becoming ≫ 1 at B8 Ia+, hence providing upper and lower limits to the spectral type (Hanson et al. 1998; 2005).
2.0–2.4 μm:
Hanson et al. (1996) present a K band spectrum from 1994, in which Brγ and He i 2.112 μm are seen in absorption. For a star of the expected luminosity of Cyg OB2 #12 and with the low S/N and resolution of the data in question, only broad constraints are possible, with the lack of He ii 2.189 μm and the presence of He i 2.112 μm implying a classification between B0-9 Ia.
2.35–4.10 μm:
finally, Lenorzer et al. (2002) and Whittet et al. (1997) present 2.35–4.1 μm spectra, which we may supplement with an additional spectrum from 1996 April 4. All four display emission in Brα, Pfα and β, with the higher transitions seen in absoprtion. No variability is apparent between any of these spectra; hence we do not reproduce them here. Unfortunately, as with the ~1–2 μm window, there is a dearth of classification features in this region and we may only infer a spectral type between B3-9 Ia+ from the presence and strength of the Brackett and Pfund series and the lack of He i photospheric lines.
To summarise – we find that the available data provides no substantive evidence for the long-term evolution of the spectral type of Cyg OB2 #12 over the past half century, although this conclusion is necessarily weaker prior to the 1990 s, given the sparser dataset available. Nevertheless, this finding is entirely consistent with the long-term lightcurve. A classification of B3-4 Ia+ appears appropiate thoughout this period, although short term variability is present in both wind (e.g. Hα...δ) and photospheric lines (e.g. Kiminki et al. 2007).
Both phenomena are common in other luminous B super-/ hypergiants (e.g. Clark et al. 2010) where they are assumed to be due to, respectively, time-dependent wind structure and photospheric pulsations resulting in changes in photospheric temperature. Regarding the latter, changes in the He i 4471 Å:Mg ii 4481 Å flux ratio have led to the conclusion that the spectral type is variable (B3-8 Ia+), from which changes in the photospheric temperature (16–12 kK) of Cyg OB2 #12 have been inferred; such a range is fully consistent with models of the pulsating B supergiant HD 64760 (Kaufer et al. 2006) and the BHGs Wd1-7 and 42 (Clark et al. 2010). However we caution that the detailed non-LTE model atmosphere analysis reveals that variation in the physical structure of the photosphere/wind transitional zone can also lead to this behaviour; hence concluding that the photospheric temperature has been variable based on the current spectroscopic dataset is clearly premature.
A.2. The early-B HGs: ζ1 Sco
A.2.1. Photometric variability
Sterken (1977) and Sterken et al. (1997) have previously undertaken long-term(differential) uvby Stromgren and V BLUW photometric campaigns between 1973–1974 and 1982−1995 respectively. They report low level (Δm ~ 0.01 mag) quasi-periodic variability over a wide range of timescales (~16.5 − ~2000 days), with additional stochastic variability (Δm ~ 0.05 mag) superimposed. (Aperiodic) low level (Δm = 0.08 mag) photometric variations were also present in the Hipparcos dataset between 1989–1993 (Lefèvre et al. 2009) and between 1979–1980 (Burki et al. 1982).
In addition to these data Sterken et al. (1997) also present historical observations from the 10th–19th Century, to which we may add a number of more recent data from the 20th Century (Table A.1). Sterken et al. (1997) suggest that ζ1 Sco is a long-term variable, reporting mV ~ 2.8 in the middle of the 18th Century, mV ~ 4.3 and 5.4 in 1875 and 1878 and mV ~ 4.5−4.8 between 1890–1900. The latter values are broadly consistent with the photometric data presented in Table A.1, which span the 20th Century and provide no evidence for the long term secular variability that characterises e.g. the LBV phase. Moreover, these data also demonstrate that the near-IR continuum is similarly stable, albeit over a shorter, ~30 yr baseline. We therefore conclude that the sole evidence for significant (ΔmV > 0.3 mag) variability is provided by historical visual estimates dating from before ~1890, for which we are unfortunately unable to quantify the observational uncertainty.
Finally, we turn to the radio data, for which Bieging et al. (1989) report possible variability. This mirrors the findings for Cyg OB2 #12 and we provisionally associate this behaviour with the same physical cause (Sect. 3).
A.2.2. Spectroscopic classification and variability
Given the brightness of ζ1 Sco, spectroscopic observations dating from the turn of the 19th Century are reported in the literature, although a lack of accurate dates for the earlier observations complicates their interpretation. Nevertheless, a summary of these observations are presented in Table A.5; we note that the lower reddening to ζ1 Sco facilitates a more homgeneous dataset of blue end spectroscopy in comparison to Cyg OB2 #12. Fortuitously, the period between 1900–1950 is well sampled and hence complements the sparse photometric dataset in this period.
This compilation reveals an absence of long-term variability or secular evolution of spectral type over a ~110 yr interval. The description of the main features of the optical spectra over this whole period are remarkably consistent; the spectra presented in Fig. A.1 for the period 1994–2009 demonstrating this stability. Nevertheless, numerous authors report line profile variability in the wind dominated P Cygni profile of Hα and β, with the higher H i transitions repeatedly varying between emission and absorption over at least a ~50 yr interval (cf. Table A.5 and refs. therein). Rivinius et al. (1997) report the rapid variability of both photospheric and wind lines between 1992–1995; we consider it likely that the variability observed in the Hα P Cygni line between 1998–2009 (Fig. 1) reflects a continuation of this behaviour.
A.3. The early-B HGs: HD 190603
Unfortunately, photometric datasets for HD 190603 are somewhat sparse in comparison to the previous two stars, with no photometric observations reported over the last decade and a >16 yr gap in the 1980 s–1990 s (Table A.1). Nevertheless, we find no evidence for secular variability over the ~46 yr period from 1952–1998. Conversely, rapid photometric variability has been reported on several occassions by both Percy & Welch (1983) and Koen & Eyer (2002).
Likewise comparatively few spectral observations have been reported, a problem exacerbated by the lack of reduced spectra being presented. Consequently we are forced to simply present the spectral classifications reported for HD 190603 in Table A.6. These data indicate a corresponding lack of spectroscopic evolution over a 50 year period. Indeed, the description of the spectrum by both Beals (1946) and Merrill & Birwell (1943) as, respectively, that of a P Cygni supergiant and a Be star, suggest a similar morphology prior to 1933. The latter authors further described variable emission lines; similar findings being reported by Rosendhal (1973) and Rivinius et al. (1997).
A.4. The early-B HGs: HD 80077, HD 169454 and BP Cru
We next turn to the remaining early-B HGs. We refrain from tabulating their sparse photometric datasets but note that there is no evidence for secular variability in any of the three stars; for instance comparison of the optical (Hiltner 1956; Kilkenny et al. 1993) and near-IR (Whittet et al. 1997; Skrutskie et al. 2006) data for HD 169454 reveal constancy over ~ 35 and ~ 26 yr intervals respectively. However, following the previous discussions, rapid, low amplitude photometric variability appears ubiquitous (van Leeuwen et al. 1998; Sterken 1977 and Hammerschlag-Hensberge et al. 1979, respectively).
As with HD 190603, Table A.6 summarises their spectral types as reported in the literature. No evidence for the long-term (secular) evolution of spectral type over timescales in excess of 30 yrs was found, with the description of HD 169454 as a B star with H i P Cygni emission lines (Merrill & Burwell 1943) suggesting spectral stability for nearly a century. In contrast line profile variability (LPV) on a timescale of days-weeks is present in all 3 stars (Knoechel & Moffat 1982; Rivinius et al. 1997; Kaper et al. 2006, respectively).
A.5. The early-BHGs/WNVL stars Wd1-5 and 13
The remaining early-B HGs are found within the massive young cluster Wd1, and on the basis of a restricted wavelength range (5800–8900 Å) were classified as borderline BHG/very late WN stars, forming an evolutionary sequence from Wd1-5 through –13 to the WN9h star Wd1-44 (Clark et al. 2008). Unfortuntely, these stars have only been observed over the past ~ decade, but no evidence for long term variability has been found (Clark et al. 2010). However, Wd1-13 is a confirmed ~ 9.27 day massive binary, while pronounced LPV in Wd1-44 also argues for such an identification. Consequently, we suspect that all three stars to have formed as the result of close binary evolution.
A.6. The late-B HGs
Finally, we examine the eight BHGs with spectral types of B5 and later that have been identified within the Galaxy. Three – W7, W33 (both B5 Ia+) and W42a (B9 Ia+) – are located within the massive young cluster Wd 1 and are discussed in detail in Clark et al. (2010). Unfortunately, the long-term spectroscopic and photometric datasets for these stars are less complete than those of the early-B HGs described above, although they are sufficient to confirm the presence of rapid LPV. This behaviour, as well as short term low amplitude photometric pulsations is also present in the other examples; HD 160529 (A9-B8 Ia+; Stahl et al. 2003), HD 168607 (B9 Ia+; Chentsov et al. 2003, Sterken et al. 1999), HD 168625 (B8 Ia+; Sterken et al. 1999; Chentsov et al. 2003), HD 183143 (B7 Iae; Adelman et al. 2000; Chentsov et al. 2003) and HD 199478 (B8 Iae; Percy et al. 2008; Markova & Valchev 2000), suggesting that the α Cygni instabilities are ubiquitous across the complete temperature and luminosity range spanned by BHGs.
This phenomenon is also found to extend to cooler temperatures, having been identified in a number of early-A (A0-2.5 Ia+/Iae) stars with similar spectral morphologies to the BHGs – e.g. HD 92207 (A0 Iae; Sterken 1977; Kaufer et al. 1997), HD 223385 (A2.5 Ia+; Adelman & Albayrak 1997; Chentsov 2003) and AS 314 (A0 Ia+; Miroshnichenko 2000).
However, unlike the early-B HGs, HD 160529 and 168607 demonstrate characteristic LBV photometric modulation, with the former also exhibiting correlated spectral type variability, while both HD 168625 and HD 92207 show evidence for a complex, dusty circumstellar environment (Roberto & Herbst 1998; Clarke et al. 2005) implying recent enhanced mass loss, possibly associated with an LBV phase.
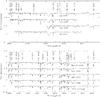 |
Fig. A.1
Long-term evolution of Cyg OB2 #12 (1992 − 2008; top panel) and ζ1 Sco (1998 − 2009; bottom panel) in the ~ 4000–4800 Å spectral region, encompassing the Si iii 4552 Å/Si ii 4128 Å temperature diagnostic. |
| Open with DEXTER | |
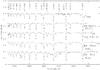 |
Fig. A.2
Comparison of the I band spectra of Cyg OB2 #12 and ζ1 Sco with other galactic BHGs. Note the systematic weakening of He i and strengthening of N i transitions with decreasing temperature, which permit spectral classification in whis wavelength range. |
| Open with DEXTER | |
Summary of historical photometric magnitudes used to construct the optical-near IR SEDs, ordered by time.
Summary of mid- to far-IR fluxes used to construct the SEDs.
Summary of mm and radio fluxes in mJy used to construct the SEDs, ordered by time.
Summmary of historical spectral observations of Cyg OB2 #12.
Summary of historical spectral observations of ζ1 Sco.
Summary of the dates of historic spectral classifications of the Galactic BHGs.
Appendix B: Spectropolarimetry
Considering a simple “core-halo” wind model for heuristic purposes, electron scattering of photospheric radiation in an asymmetric outflow will generate a grey intrinsic linear polarization, while emission lines formed in the wind will see a smaller scattering optical depth, and so are expected to be less polarized (e.g., McLean 1979). This will result in depolarization through the line, although the addition of an interstellar-polarization vector means that this “line effect” often manifests in other ways, including an observed increase in degree of polarization, P.
Previously unpublished spectropolarimetric observations of Cyg OB2 #12 and ζ1 Sco were obtained as part of the investigations reported by Harries et al. (2002). Cyg OB2 #12 was observed on 1995 July 17 (using the WHT with ISIS spectrograph; R ≃ 3300), and ζ1 Sco on 1997 Jun. 5 (AAT with RGO spectrograph; R ≃ 5000), with the data acquisition and reduction essentially as in the manner described by Harries & Howarth (1996). Results are displayed in Fig. B.1.
For Cyg OB2 #12 there is no compelling evidence of a change in polarization through the Hα emission line (although there is a hint of a possible increase in P), and hence no strong indication of large-scale asymmetry in the electron-scattering envelope. Similarly, there is no strong evidence for temporal polarimetric variability; although the spread in published R-band photopolarimetric measurements is somewhat larger than their quoted formal errors, the results presented by Schmidt et al. (1992; P = 7.893 ± 0.037%, θ = 116.23 ± 0.14°) Whittet et al. (1992; 7.97 ± 0.05%, 117°), and Kobulnicky et al. (1994; 8.35 ± 0.21%, 117.8°) are all broadly consistent with the present results, as are earlier O-band measurements reported by Kruszewski (1971) and by McMillan & Tapia (1977). We note, however, an anomalous result reported by Schulz & Lenzen (1983; P = 10.05 ± 0.12%, θ = 125°); their observations of two further stars agree well with measurements presented by Schmidt et al. (1992).
In spite of its brightness, ζ1 Sco has been much less extensively observed, with the only available point of direct comparison being the narrow-band (Δλ = 8.5 Å) Hα polarimetric measurement of P = 2.39 ± 0.03%, θ = 64.6° reported by McLean & Clarke (1979)11. This is in agreement with our results; however, our spectropolarimetry clearly reveals a significant, ~ 1.5° position-angle rotation through the emission line.
Physically, the line effect may be associated with large-scale, axisymmetric structures (such as might result from rapid rotation), or irregular “clumps”. For a star with parameters similar to those of ζ1 Sco, summarized in Table 4, the critical equatorial rotation velocity12 is ve ≃ 210 kms-1. With a measured vesini of ~ 45 kms-1 (Table 3), the intrinsic rotation is probably substantially subcritical (ve/vcrit ≲ 0.69 with 95% confidence). A rotationally-induced axisymmetric departure from spherical symmetry (i.e. a “disc” or “polar” wind) therefore seems a priori improbable as the origin of the line effect in this star. A more likely cause of the observed change in polarization is the presence of transient large-scale inhomogenities, or “clumps”, as has been proposed for P Cygni and AG Car on the basis of spectropolarimetric observations by e.g. Nordsieck et al. (2001) and Davies et al. (2005); indeed CMFGEN model atmosphere analysis of both these stars confirms the presence of the significant wind clumping (Najarro et al. 2001; Groh et al. 2009a). Therefore, by direct analogy, an additional observational test of this hypothesis for ζ1 Sco would be the detection of time-dependent variations in polarization (under the assumption that there is no prefered geometry for the clumping), noting that spectroscopic observations are already strongly indicative of the presence of transient wind structure (Appendix A).
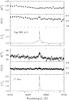 |
Fig. B.1
Linear spectropolarimetry of Cyg OB2 #12 and ζ1 Sco. Rectified spectra are shown at full resolution; polarimetry is binned to an (almost) constant error of 0.05% in degree of polarization. |
| Open with DEXTER | |
Appendix C: The age of NGC 6231 and Sco OB1
Given its proximity (~1.64 kpc; Sana et al. 2008), NGC 6231, its host association Sco OB1, and the massive stars located within both have been the subject of numerous multiwavelength studies. Here we review these data in order to constrain the evolutionary history of both cluster and association to better understand the nature of ζ1 Sco. Photometric studies by Baume et al. (1999) suggest a significant age spread within NGC 6231, with star formation apparently commencing ~10 Myr ago, culminating in the formation of the massive stellar cohort ~3−5 Myr ago. The latter age is consistent with the findings of Sana et al. (2006a, 2007), who report a similar value of 2 − 4 Myr from an analysis of the photometric data of (X-ray selected) pre-MS stars. An analagous study of the wider Sco OB1 association by Perry et al. (1991) supports a non coeval star formation history for this region, yielding an age of  Myr.
Myr.
Catalogues of the OB stellar content of both NGC 6231 and Sco OB1 are provided by Sana et al. (2006b) and Ankay et al. (2001) respectively, and allow for the individual placement of stars on the HR diagram presented in Fig. 13. For those stars in Sana et al. we adopted the luminosities given by these authors and utilised the spectral type/temperature relation of Martins et al. (2005). The temperatures and luminosities of the stars in Ankay et al. were again determined via the callibrations of Martins et al., with reddening for individual stars calculated via the intrinsic colours of Martins & Plez (2006). Finally, given their rather evolved nature, we adopted the results of the tailored non-LTE analysis of Crowther & Evans (2009) for HD 151804 and 152408.
Comparison of these data to non-rotating and rotating Geneva isochrones clearly indicate that the region as a whole appears non coeval, at first glance being consistent with a spread of ages of between 2.5 − 5 Myr. Such a conclusion is supported by inspection of the properties of individual stars in both association and cluster, although interpretation is complicated by possible contamination of the latter by the former if, as seems likely, Sco OB1 hosts a younger population than is found in NGC 6231.
A large number of Main Sequence (MS) stars are found within NGC 6231, with the O8 V companion in the binary HD 152234 apparently being the earliest and defining the MS turnoff; consistent with an age of 5 Myr. While an O6 V companion to the WC7 star WR 79 has been reported (Hill et al. 2000) the 126 day binary period of HD 152234 will have ensured that neither component in this system will have interacted, while the 8.89 day period of WR79 indicates that significant mass transfer to the secondary may have occured (e.g. Petrovic et al. 2005). Encouragingly, the O9.7Ia primary of HD 152234 also lies on the 5 Myr isochrone for rapid initial rotation, with the current vsini also being consistent with this placement (Fraser et al. 2010).
Building on this approach, we find that HD 152219 (O9.5 III + B1-2 III-V) and HD 152134 (B0.5 Ia) lie upon the 5 Myr evolutionary track for non-rotating stars, with – sequentially – HD 326331 (O8 III((f))), HD 152247 (O9 III), HD 152249 (O9 Ib((f))) and HD 152234 (O9.7 Ia + O8 V) following the rotating track. In both cases the systematic progression to later spectral types with increasing luminosity class suggest these are real evolutionary sequences (cf. Cyg OB2; Negueruela et al. 2008).
However, there are a number of stars within NGC 6231 and Sco OB1 that appear incompatable with a ~5 Myr population: the O8 Iafpe/WN9ha stars HD 151804 and 152048 and the O5.5-7.5 III stars HD 151515, 152723, 152233 and 152248. Regarding the former pair, Bohannan & Crowther (1999) suggest a close physical kinship between these objects, apparently precluding an evolution through the cooler late-O/early-BSG phase present in NGC 6231. Of the mid-O giants, HD 151515 and 152723 appear somewhat subluminous for their spectral type but the properties of the O5.5 III(f) + O7.5 and O7.5 III(f) + O7 III(f) binaries HD 152233 and 152248 (Sana et al. 2008; 2001) clearly support the assertion that a younger population is present; although the dymanical masses for both components of the latter system appear somewhat lower than expected (29.6 M⊙ and 29.9 M⊙ respectively).
We therefore conclude that comparison of NGC 6231 to Sco OB1 implies that the respective stellar populations are non coeval. However, with the exception of HD 152233 and HD 152248, the massive stellar population of NGC6231 appears consistent with a single burst of star formation ~5 Myr ago. Indeed, no early-mid O MS stars consistent with a younger population appears present within NGC 6231, while the population of late-O/early-B MS stars that are present are systematically displaced redwards from the ≤ 3 Myr isochrones. Therefore, if they are members of NGC 6231, we cannot exclude the possibility that, with spectral types < O8, HD 152233 and HD 152248 are in fact bona fide blue stragglers; having evolved via a different pathway from the majority of stars and hence that NGC 6231 is truly coeval. In this respect it would therefore closely resemble Cyg OB2, for which Negueruela et al. (2008) arrived at a comparable conclusion.
Appendix D: Spectral fits to ζ1 Sco and HD 190603
We present additional model fits to ζ1 Sco based on the FEROS (3700–8850 Å) optical data (not presented in the paper version due to reasons of space).
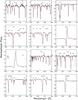 |
Fig. D.1
Comparison of the synthetic spectrum of ζ1 Sco (red dashed line) to observational data for various transitions between 4090–22 100 Å. Optical data correspond to the FEROS data kindly provided by Otmar Stahl. Note the lack of long-term variability between these data and those presented in Fig. 7. |
| Open with DEXTER | |
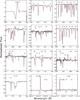 |
Fig. D.1
continued. |
| Open with DEXTER | |
© ESO, 2012
Current usage metrics show cumulative count of Article Views (full-text article views including HTML views, PDF and ePub downloads, according to the available data) and Abstracts Views on Vision4Press platform.
Data correspond to usage on the plateform after 2015. The current usage metrics is available 48-96 hours after online publication and is updated daily on week days.
Initial download of the metrics may take a while.