| Issue |
A&A
Volume 539, March 2012
|
|
|---|---|---|
| Article Number | A155 | |
| Number of page(s) | 35 | |
| Section | Extragalactic astronomy | |
| DOI | https://doi.org/10.1051/0004-6361/201118312 | |
| Published online | 12 March 2012 | |
Online material
Main properties of the PEP/HerMES fields used in this study.
Main properties of the ancillary used in this study.
Mid- and far-infrared properties of our GOODS-N SMG sample.
Submm, radio and redshift properties for our GOODS-N SMG sample.
Mid- and far-infrared properties of our GOODS-S SMG sample.
Submm, radio and redshift properties for our GOODS-S SMG sample.
Mid- and far-infrared properties of our LH SMG sample.
Submm, radio and redshift properties for our LH SMG sample.
Mid- and far-infrared properties of our COSMOS SMG sample.
Submm, radio and redshift properties for our COSMOS SMG sample.
Mid- and far-infrared properties of our lensed-SMG sample.
Submm, radio, redshift and magnification properties for our lensed-SMG sample.
Dust properties of our SMGs.
Appendix A: SED fits
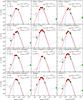 |
Fig. A.1
Spectral energy distribution of our SMGs. Red diamonds present the PACS and SPIRE measurements, while green squares present multi-wavelength ancillary data taken from the literature. The modified blackbody emission (β = 1.5) best-fitting the data are shown by dashed blue lines. The power-law temperature distribution model (β = 2.0, γ = 7.3 and R = 3 kpc) which best-fits the data are shown by solid red lines. Dotted lines present the CE01 SED template which best-fits the far-infrared observations. |
| Open with DEXTER | |
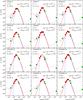 |
Fig. A.1
continued. |
| Open with DEXTER | |
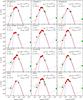 |
Fig. A.1
continued. |
| Open with DEXTER | |
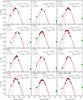 |
Fig. A.1
continued. |
| Open with DEXTER | |
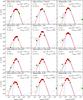 |
Fig. A.1
continued. |
| Open with DEXTER | |
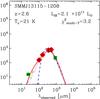 |
Fig. A.1
continued. |
| Open with DEXTER | |
© ESO, 2012
Current usage metrics show cumulative count of Article Views (full-text article views including HTML views, PDF and ePub downloads, according to the available data) and Abstracts Views on Vision4Press platform.
Data correspond to usage on the plateform after 2015. The current usage metrics is available 48-96 hours after online publication and is updated daily on week days.
Initial download of the metrics may take a while.