| Issue |
A&A
Volume 537, January 2012
|
|
|---|---|---|
| Article Number | A106 | |
| Number of page(s) | 19 | |
| Section | Galactic structure, stellar clusters and populations | |
| DOI | https://doi.org/10.1051/0004-6361/201117863 | |
| Published online | 17 January 2012 | |
Online material
Appendix A: SFH results for each subregion
For the sake of completeness, this appendix presents the SFH results for all subregions of all tiles. All SFH data, including tables and figures, are available on the VMC main site, http://star.herts.ac.uk/~mcioni/vmc/, and are regularly updated as the survey and analysis proceed.
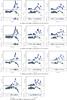 |
Fig. A.1
SFH for the subregions of the 8_8 tile. The panel are disposed in the same way as seen in the sky, with North to the top and West to the right (see Fig. 2). The bottom right panels represent subregions closer to the LMC centre. |
| Open with DEXTER | |
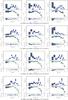 |
Fig. A.2
Same as in Fig. A.1, but for the SFH for the 8_3 tile. The bottom left panels represent subregions closer to the LMC centre. |
| Open with DEXTER | |
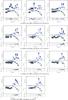 |
Fig. A.3
Same as in Fig. A.1, but for the SFH for the 4_3 tile. The top left panels represent subregions closer to the LMC centre. |
| Open with DEXTER | |
© ESO, 2012
Current usage metrics show cumulative count of Article Views (full-text article views including HTML views, PDF and ePub downloads, according to the available data) and Abstracts Views on Vision4Press platform.
Data correspond to usage on the plateform after 2015. The current usage metrics is available 48-96 hours after online publication and is updated daily on week days.
Initial download of the metrics may take a while.