| Issue |
A&A
Volume 536, December 2011
|
|
|---|---|---|
| Article Number | A55 | |
| Number of page(s) | 11 | |
| Section | Stellar structure and evolution | |
| DOI | https://doi.org/10.1051/0004-6361/201118036 | |
| Published online | 07 December 2011 | |
Online material
Appendix A: Data and results of the parametric modelling
The interferometric data are plotted in Figs. A.1–A.3 (visibilities and closure phases). The reduced data are available on Vizier/CDS. We also plotted on these figures the visibilities and closure phases obtained from our binary model with the best parameters. Table A.1 and Fig. A.4 present the best parameters with the data. We indicate for each observation which parameters are free in the fitting procedure. The relative fluxes are always free parameters and are considered to be chromatic. Uncertainties on the fitted parameters were computed with Monte-Carlo simulations from the errors on the visibilities and closure phases.
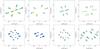 |
Fig. A.1
(u,v)-plane coverage for observations of SS Lep (top: AMBER; bottom: PIONIER). |
| Open with DEXTER | |
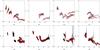 |
Fig. A.2
Visibility curves for the observations of SS Lep. The order of the figures corresponds to the (u,v)-plan coverages in Fig. A.1. In black are the data with error bars. The visibility curves from our model with the best parameters are in red. |
| Open with DEXTER | |
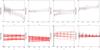 |
Fig. A.3
Closure phase curves for the observations for the observations of SS Lep. The order of the figures corresponds to the (u,v)-plan coverages in Fig. A.1 In black are the data with error bars. The visibility curves from our model with the best parameters are in red. |
| Open with DEXTER | |
Most reliable parameters obtained with the 8 data sets.
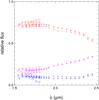 |
Fig. A.4
Relative flux contribution of the M giant (red), the A star (blue), and the envelope (magenta). The different symbols represent the different observations A1 ( + ), A3 ( × ), P1 (Λ), P2 ( △ ), P3 ( ▽ ), P4 ( ◯ ). |
| Open with DEXTER | |
© ESO, 2011
Current usage metrics show cumulative count of Article Views (full-text article views including HTML views, PDF and ePub downloads, according to the available data) and Abstracts Views on Vision4Press platform.
Data correspond to usage on the plateform after 2015. The current usage metrics is available 48-96 hours after online publication and is updated daily on week days.
Initial download of the metrics may take a while.