| Issue |
A&A
Volume 533, September 2011
|
|
|---|---|---|
| Article Number | A27 | |
| Number of page(s) | 18 | |
| Section | Stellar structure and evolution | |
| DOI | https://doi.org/10.1051/0004-6361/201116538 | |
| Published online | 22 August 2011 | |
Online material
Appendix A: Statistical approach at temperature determination
In order to assign an observed spectrum to one out of a sample of available models, a statistical approach is employed: each model represents a Gaussian-shaped sandheap the width of which (in terms of standard deviation) is determined by the point-to-point scatter p of the spectrum. The height of the sandheaps can be adjusted by statistical weights. Thus, the shape of the nth sandheap is given by the Gaussian probability density function 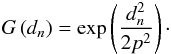 (A.1)The “distance” dn between the observed spectrum and the model is the rms deviation between the observed and the synthetic spectrum. The statistical analogy of the model assignment is to pick out a single grain of sand at the given distances from the synthetic spectra. Now the question is, how high is the probability of the picked grain to belong to the nth sandheap?
The total number of available grains at the selected position is determined by the sum of densities for all N models,  (A.2)which represents our normalisation condition. Thus, the relative amount of grains belonging to model n – and hence
the probability of the observed spectrum to represent this model – evaluates to 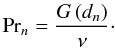 (A.3)
(A.3)
In the context of our application, the only parameter of interest is the effective temperature, whence the temperature interval covered by the models is divided into a set of intervals It, t = 1,...,τ. Because the number of models belonging to such a temperature bin is not unique, the marginal probability density of temperature has to be corrected for this bias. In the sandheap metaphor, we would have to provide each temperature interval to be represented by a unique number of grains, and the probability of our spectrum to be assigned to the temperature interval It evaluates to the weighted sum of individual model assignment probabilities 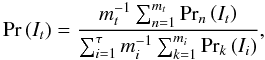 (A.4)mtand denoting the number of models belonging to the interval It.
This normalisation is demonstrably valid, because the integral probability for all temperatures evaluates to 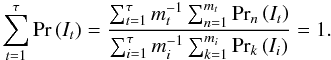 (A.5)
(A.5)
Interferometric observations.
© ESO, 2011
Current usage metrics show cumulative count of Article Views (full-text article views including HTML views, PDF and ePub downloads, according to the available data) and Abstracts Views on Vision4Press platform.
Data correspond to usage on the plateform after 2015. The current usage metrics is available 48-96 hours after online publication and is updated daily on week days.
Initial download of the metrics may take a while.