| Issue |
A&A
Volume 529, May 2011
|
|
|---|---|---|
| Article Number | A95 | |
| Number of page(s) | 12 | |
| Section | Interstellar and circumstellar matter | |
| DOI | https://doi.org/10.1051/0004-6361/201116648 | |
| Published online | 11 April 2011 | |
Online material
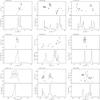 |
Fig. 5
Total intensity spectra (bottom) and Zeeman splitting (top) for all the sources of our sample with a significant detection. The Zeeman splitting is derived using the “running” cross-correlation method (see Paper I). |
| Open with DEXTER | |
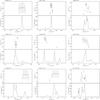 |
Fig. 5
continued. |
| Open with DEXTER | |
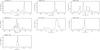 |
Fig. 6
Total intensity spectra of the sources in our sample observed with Effelsberg for which no significant Zeeman splitting was detected. |
| Open with DEXTER | |
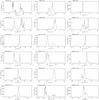 |
Fig. 7
Total intensity spectra of the sources in our sample observed with Parkes for which we were unable to determine the Zeeman splitting. |
| Open with DEXTER | |
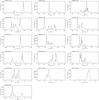 |
Fig. 7
continued. |
| Open with DEXTER | |
Parkes observations.
© ESO, 2011
Current usage metrics show cumulative count of Article Views (full-text article views including HTML views, PDF and ePub downloads, according to the available data) and Abstracts Views on Vision4Press platform.
Data correspond to usage on the plateform after 2015. The current usage metrics is available 48-96 hours after online publication and is updated daily on week days.
Initial download of the metrics may take a while.