| Issue |
A&A
Volume 529, May 2011
|
|
|---|---|---|
| Article Number | A67 | |
| Number of page(s) | 8 | |
| Section | The Sun | |
| DOI | https://doi.org/10.1051/0004-6361/201016173 | |
| Published online | 04 April 2011 | |
Online material
Appendix A: Spectral synthesis
A.1. Quiet Sun
The quiet Sun is a combination of different brightness components and the evolution of their fractional contributions drives its activity and long-term irradiance variability. The four main components of the quiet Sun (Vernazza et al. 1981; Fontenla et al. 1999) are: component A (faint supergranule cell interior), component C (average supergranule cell interior), component E (average network or quiet network), and component F (bright network).
We calculated the synthetic spectra IA, IC, IE, IP of all these components employing the NLTE (non-local thermodynamic equilibrium) COde for Solar Irradiance (Haberreiter et al. 2008; Shapiro et al. 2010) (COSI). Recently, Shapiro et al. (2010) showed that COSI calculations with the atmosphere model for component C reproduces spectral irradiance measurements from the last two solar minima with good accuracy. This is used in Eq. (1) from the main text, where Ipresent(λ) is substituted by the irradiance IC(λ) for component C.
The evolution of the magnetic activity of the quiet Sun can be represented by the time-dependent fractional contributions (i.e. filling factors) of different components of the quiet Sun. The quiet Sun can be described by model A with varying contributions from the brighter components. We compose the quiet Sun using model A and model E, which is an adequate representation of the brighter contributions.
Using COSI we demonstrate (see Fig. A.1) that the solar irradiance for model C and, therefore, the measured solar irradiance for the last two minima, can be successfully reproduced with a combination of  model A and
  model E (
 ):
):  (A.1)The linear scaling of the magnetic activity of the quiet Sun with proxies, as described in the main text, is equivalent to setting the model E filling factor to be proportional to a chosen proxy. Then the time-dependent irradiance of the quiet Sun can be calculated:
  (A.2)where
  (A.3)The set of Eqs. (A.1 − A.3) is equivalent to Eq. (1).
There is an ongoing discussion of whether the trend in the filling factor of the quiet network can be detected.
It was suggested (Foukal & Milano 2001) that the analysis of the historical Mt. Wilson observations exclude the existence of the trend between 1914 and 1996. However, this analysis was criticized for using uncalibrated data (Solanki & Krivova 2004) and also contradicts other studies (Lockwood 2010). Thus only the future long-term monitoring of the quiet Sun with high resolution or the recently proposed (Kleint et al. 2010) monitoring of weak turbulent magnetic fields can help to clarify this question.
A.2. Active Sun
From 1610 onward we have additional information from the sunspot number, which allows the calculation of the active regions contribution to the solar irradiance (Iactive(λ,t) in Eq. (2)). For this we follow the approach by Krivova et al. (2003). Because our main goal is to reproduce the centennial solar variability and because magnetograms are unavailable for historical time periods, we scale the faculae and the active network filling factors with the sunspot number instead of using filling factors derived from available magnetogram data. The synthetic spectra are then added according to their filling factors, and the TSI is then determined by integrating over all wavelengths.
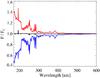 |
Fig. A.1
Representation of the quiet Sun by a combination of models. Ratios of synthetic solar spectra of models A (blue) and E (red) to model C. The black line results by combining 57% of the model E spectrum with 43% of the model A spectrum. The spectral signatures are almost perfectly cancelled, implying that the combination of both spectra is equal to the model C spectrum. The latter has been demonstrated to accurately reproduce the observed solar spectra during the last two minima (Shapiro et al. 2010). Hence, a combination of spectra for models A and E reproduces the observed quiet Sun spectrum. |
| Open with DEXTER | |
© ESO, 2011
Current usage metrics show cumulative count of Article Views (full-text article views including HTML views, PDF and ePub downloads, according to the available data) and Abstracts Views on Vision4Press platform.
Data correspond to usage on the plateform after 2015. The current usage metrics is available 48-96 hours after online publication and is updated daily on week days.
Initial download of the metrics may take a while.