| Issue |
A&A
Volume 526, February 2011
|
|
|---|---|---|
| Article Number | L2 | |
| Number of page(s) | 13 | |
| Section | Letters | |
| DOI | https://doi.org/10.1051/0004-6361/201015827 | |
| Published online | 13 December 2010 | |
Online material
Appendix A: Tables
Properties of the clumps derived from modified black body fits to their SEDs.
Parameters of the SiO(2–1) and (3–2) lines, and HCO+ outflow detection.
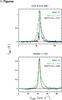 |
Fig. B.1
SiO(2–1) (blue), SiO(3–2) (green), and HCO+(1–0)(black) spectra observed towards the IR-dark source G34.43+0.2M1 and the IR-loud source 18264–1152. The vertical dotted lines mark the systemic velocity of the clump, listed in Col. 5 of Table A.2. |
| Open with DEXTER | |
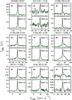 |
Fig. B.2
SiO(2–1) and (3–2) spectra. The dashed vertical line marks the systemic velocity of the clump, listed in Col. 5 of Table A.2. |
| Open with DEXTER | |
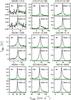 |
Fig. B.2
continued. |
| Open with DEXTER | |
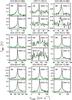 |
Fig. B.2
continued. |
| Open with DEXTER | |
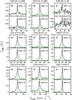 |
Fig. B.2
continued. |
| Open with DEXTER | |
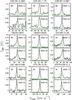 |
Fig. B.2
continued. |
| Open with DEXTER | |
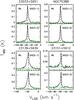 |
Fig. B.2
continued. |
| Open with DEXTER | |
© ESO, 2010
Current usage metrics show cumulative count of Article Views (full-text article views including HTML views, PDF and ePub downloads, according to the available data) and Abstracts Views on Vision4Press platform.
Data correspond to usage on the plateform after 2015. The current usage metrics is available 48-96 hours after online publication and is updated daily on week days.
Initial download of the metrics may take a while.