| Issue |
A&A
Volume 521, October 2010
Herschel/HIFI: first science highlights
|
|
|---|---|---|
| Article Number | L35 | |
| Number of page(s) | 5 | |
| Section | Letters | |
| DOI | https://doi.org/10.1051/0004-6361/201015111 | |
| Published online | 01 October 2010 | |
Online Material
Appendix A:
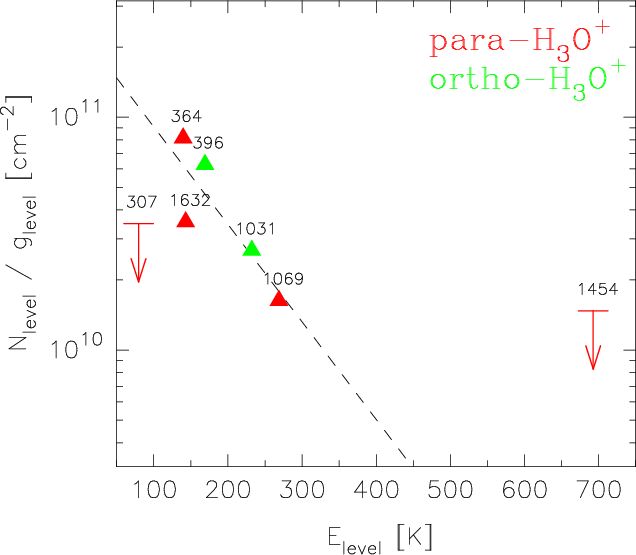
The rotational diagram in Fig. A.1
is complemented with ground-based data for the frequency range
300-400 GHz observed at the CSO with comparable beam size by
Phillips et al. (1992). The non-detection at 307 MHz is surprising, but possibly an effect of optical depth. The data in Fig. A.1,
except 307 GHz, are well fitted by a single rotational temperature
of 239 K, suggesting that the observed levels are populated
according to an exponential distribution. The derived temperature and
column density infer an optical depth of
![]() for all lines except at 307 GHz. The fitted line (dashed) corresponds to a column density of
for all lines except at 307 GHz. The fitted line (dashed) corresponds to a column density of
![]() cm-2, consistent with the value derived by Phillips et al. (1992). This leads to a beam averaged H3O+ abundance of
cm-2, consistent with the value derived by Phillips et al. (1992). This leads to a beam averaged H3O+ abundance of
![]() relative to H, to be compared with the theoretical value of
relative to H, to be compared with the theoretical value of
![]() reported by Bruderer et al. (2010a).
reported by Bruderer et al. (2010a).
|
Figure A.1: Rotational diagram of H3O+. Numbers indicate the frequencies in GHz of the observed lines. |
| Open with DEXTER | |
Current usage metrics show cumulative count of Article Views (full-text article views including HTML views, PDF and ePub downloads, according to the available data) and Abstracts Views on Vision4Press platform.
Data correspond to usage on the plateform after 2015. The current usage metrics is available 48-96 hours after online publication and is updated daily on week days.
Initial download of the metrics may take a while.