| Issue |
A&A
Volume 520, September-October 2010
|
|
|---|---|---|
| Article Number | A20 | |
| Number of page(s) | 20 | |
| Section | Interstellar and circumstellar matter | |
| DOI | https://doi.org/10.1051/0004-6361/201014283 | |
| Published online | 23 September 2010 | |
Online Material
Appendix A: Gaussian decomposition and calculation of column densities
Table A.1: HCO+ (0-1) absorption line analysis results.
Table A.2: HNC (0-1) absorption line analysis products.
Table A.3: HCN (0-1) absorption line analysis products.
Table A.4: CN (0-1) absorption line analysis products.
Tables A.1-A.4 contains the
results of the Gaussian
decompostion procedure that we have applied to the spectra. The column
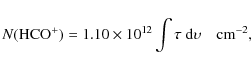
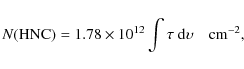
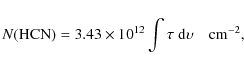
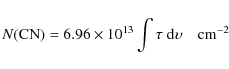
densities, given in the last columns, are derived assuming a single
excitation temperature ![]() for all the levels of a given molecule as
for all the levels of a given molecule as
![\begin{displaymath}
N = Q(T_{\rm ex}) \frac{8 \pi \nu_0^{3}}{c^{3}} \frac{g_{\rm...
...h\nu_0/k T_{\rm ex}} \right]^{-1} \int \tau ~ {\rm d}\upsilon
\end{displaymath}](/articles/aa/olm/2010/12/aa14283-10/img314.png)
where
|
(A.2) |
|
(A.3) |
|
(A.4) |
and
|
(A.5) |
using the HCO+ J=0-1, HNC J=0-1, HCN J,F=0,1-1,2, and CN J,F1,F=0,1/2,3/2-1,1/2,3/2 transitions respectively.
Appendix B: Impact of the abscissa uncertainty on the multi-Gaussian decomposition procedure
In a spectrum, the possible velocity substructures are systematically
erased due to the finite velocity resolution
![]() .
This could be
modelled as an uncertainty on the velocity position of each point.
Unfortunately the errors on the abscissa are rarely included in
non-linear fitting
procedures because the system is considerably heavier to solve and
because it
often prevents convergence. To evaluate the resulting uncertainties on
the fit
parameters, namely the central opacity, the velocity centroid, and the FWHM,
we apply the fitting procedure on 3000 synthetic spectra of FWHM
.
This could be
modelled as an uncertainty on the velocity position of each point.
Unfortunately the errors on the abscissa are rarely included in
non-linear fitting
procedures because the system is considerably heavier to solve and
because it
often prevents convergence. To evaluate the resulting uncertainties on
the fit
parameters, namely the central opacity, the velocity centroid, and the FWHM,
we apply the fitting procedure on 3000 synthetic spectra of FWHM
![]() varying
between 0.3 and 3.4 km s-1 sampled with
the finite
spectral resolution of the observations
varying
between 0.3 and 3.4 km s-1 sampled with
the finite
spectral resolution of the observations
![]() km s-1. A noise is added to
the x-coordinates of all the spectral points. The
rms of all
the measured linewidths
km s-1. A noise is added to
the x-coordinates of all the spectral points. The
rms of all
the measured linewidths ![]() is found to scale as
is found to scale as
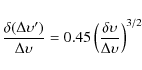
|
(B.1) |
and decreases from 0.04 to 0.01 km s-1 as the true linewidth increases from 0.3 to 3.4 km s-1. These uncertainties are smaller than (or comparable to) those inferred from the fitting procedure and the resulting errors on the column densities are at most 12%. In comparison the resulting errors on central opacities and velocity centroids are negligible.
Appendix C: Cyanides chemical network
Table C.1: Rates k of the main reactions of the cyanide chemistry.
Figures C.1
and C.2
show the main production and destruction pathways of the hydrogenation
chains of carbon, nitrogen, and
cyano, resulting from the PDR (
![]() cm-3,
AV = 0.4)
and
TDR (
cm-3,
AV = 0.4)
and
TDR (
![]() cm-3,
AV = 0.4,
a
= 10-11 s-1)
models
respectively. These figures are simplified: for each species, only the
reactions which altogether contribute at least to 70 percent of the
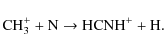
total destruction and formation rate are displayed. There is one major
difference between these networks: in a UV-dominated chemical model,
the cyanide chemistry is initiated by:
cm-3,
AV = 0.4,
a
= 10-11 s-1)
models
respectively. These figures are simplified: for each species, only the
reactions which altogether contribute at least to 70 percent of the
total destruction and formation rate are displayed. There is one major
difference between these networks: in a UV-dominated chemical model,
the cyanide chemistry is initiated by:
| (C.1) |
| (C.2) |
and
| (C.3) |
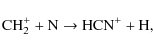
while in a chemistry driven by turbulent dissipation, the hydrogenation chain of cyano is triggered by the ion-neutral reactions:
| (C.4) |
|
(C.5) |
and
|
(C.6) |
Since the pathways displayed in Figs. C.1 and C.2 depend on the chemical rates, and since the nitrogen and cyanide chemistry are still poorly known, we list the chemical rates we have adopted in our models for several reactions in Table C.1.
![\begin{figure}
\par\includegraphics[width=14cm,clip]{14283-fig8.eps}
\end{figure}](/articles/aa/olm/2010/12/aa14283-10/img341.png)
|
Figure C.1:
Chemical network of a UV-dominated chemistry: |
| Open with DEXTER | |
![\begin{figure}
\includegraphics[width=14cm,clip]{14283-fig9.eps} %\end{figure}](/articles/aa/olm/2010/12/aa14283-10/img342.png)
|
Figure C.2:
Same as Fig. C.1
for a turbulence-dominated chemistry: |
| Open with DEXTER | |
Current usage metrics show cumulative count of Article Views (full-text article views including HTML views, PDF and ePub downloads, according to the available data) and Abstracts Views on Vision4Press platform.
Data correspond to usage on the plateform after 2015. The current usage metrics is available 48-96 hours after online publication and is updated daily on week days.
Initial download of the metrics may take a while.