| Issue |
A&A
Volume 505, Number 1, October I 2009
|
|
|---|---|---|
| Page(s) | 287 - 298 | |
| Section | Stellar atmospheres | |
| DOI | https://doi.org/10.1051/0004-6361/200811436 | |
| Published online | 24 July 2009 | |
Online Material
Table 1: Log of spectroscopic observations of RS Oph.
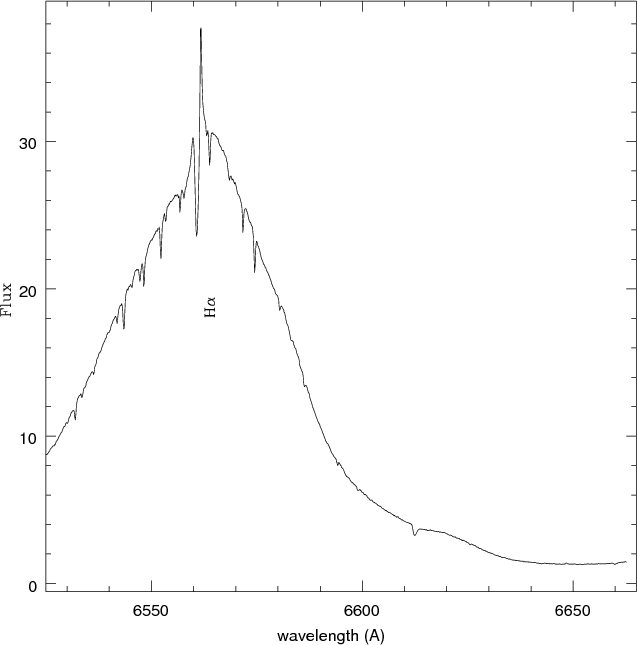 |
Figure 1:
Profile of H |
| Open with DEXTER | |
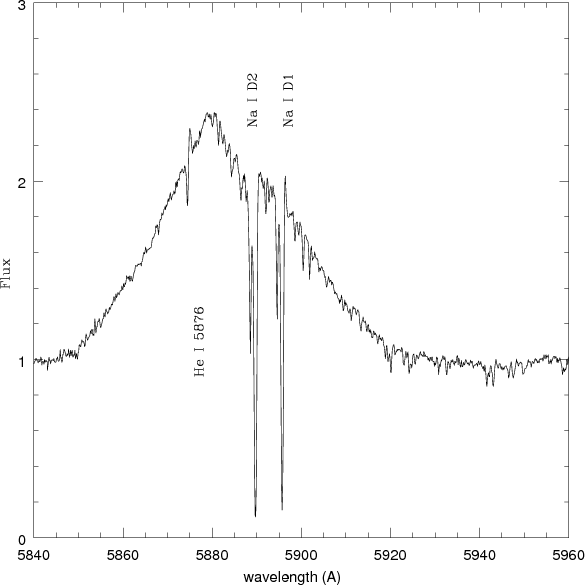 |
Figure 2: Profile of He I 5876 on Feb. 18. The unit of the ordinate is 10-11 erg cm-2 s-1 Å-1. |
| Open with DEXTER | |
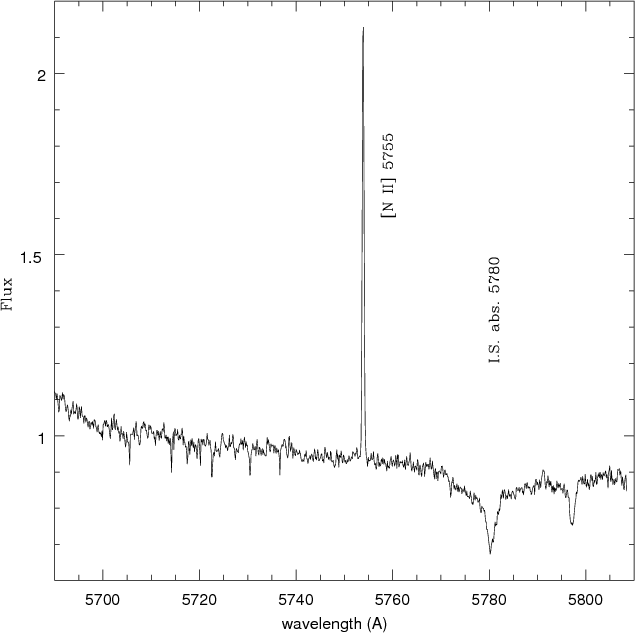 |
Figure 3: Profile of [N II] 5755 on Feb. 18. The unit of the ordinate is 10-11 erg cm-2 s-1 Å-1. |
| Open with DEXTER | |
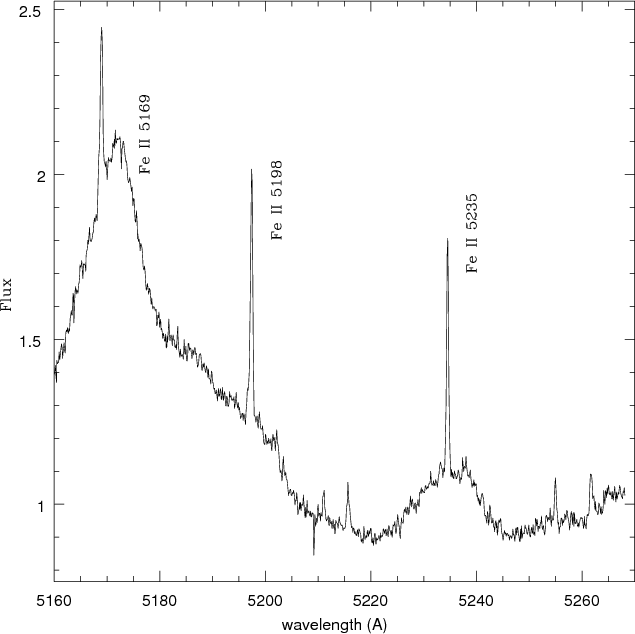 |
Figure 4: Profiles of Fe II lines on Feb. 18. The unit of the ordinate is 10-11erg cm-2 s-1 Å-1. |
| Open with DEXTER | |
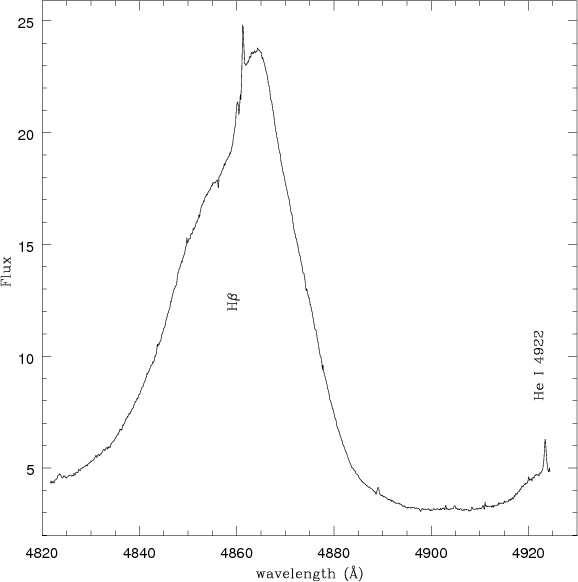 |
Figure 5:
Profile of H |
| Open with DEXTER | |
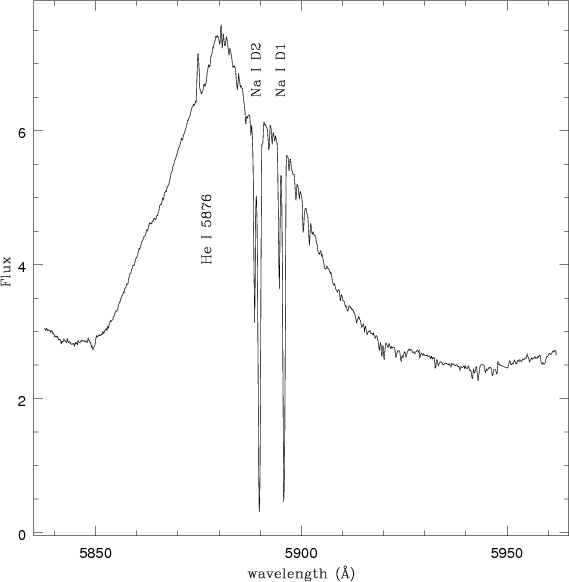 |
Figure 6: Profile of He I 5876 on Feb. 19. The unit of the ordinate is 10-11 erg cm-2 s-1 Å-1. |
| Open with DEXTER | |
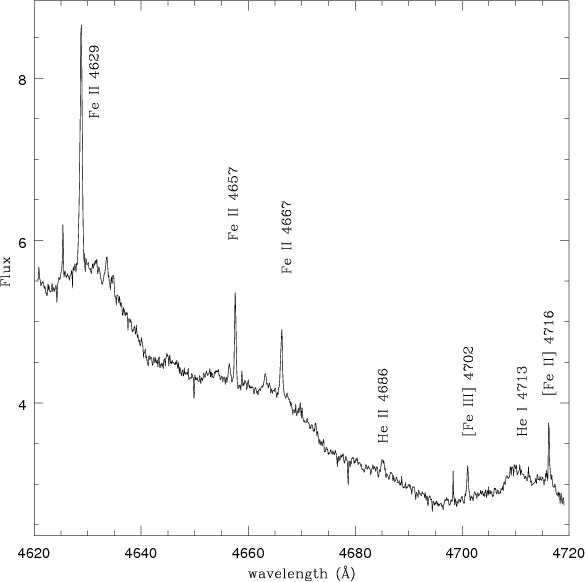 |
Figure 7: High dispersion spectrum on Feb. 19: 4620-4720Å. The unit of ordinate is 10-11 erg cm-2 s-1 Å-1. |
| Open with DEXTER | |
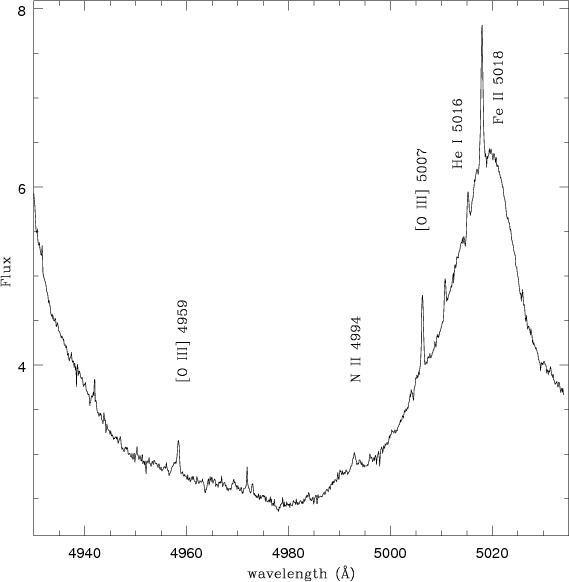 |
Figure 8: High dispersion spectrum on Feb. 19: 4930-5030Å. The unit of ordinate is 10-11 erg cm-2 s-1 Å-1. |
| Open with DEXTER | |
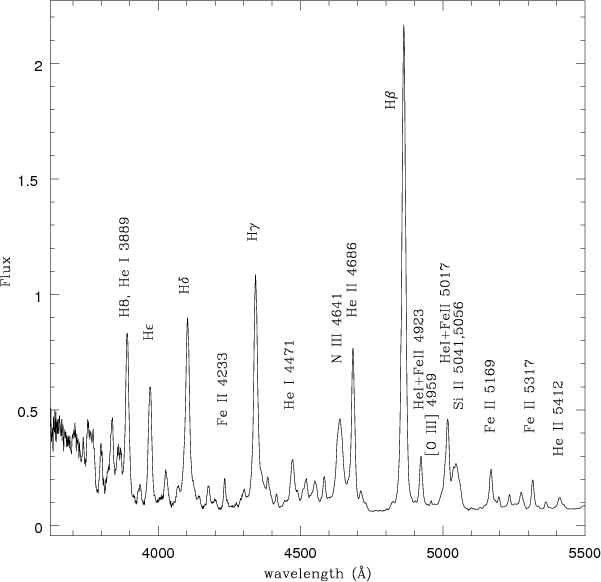 |
Figure 9: Medium dispersion blue spectrum on March 6. The unit of ordinate is 10-11 erg cm-2 s-1 Å-1. |
| Open with DEXTER | |
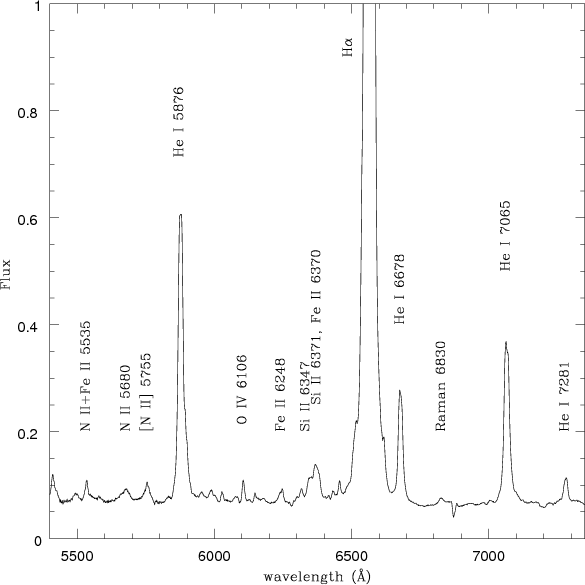 |
Figure 10: Medium dispersion red spectrum on March 6. The unit of ordinate is 10-11 erg cm-2 s-1 Å-1. |
| Open with DEXTER | |
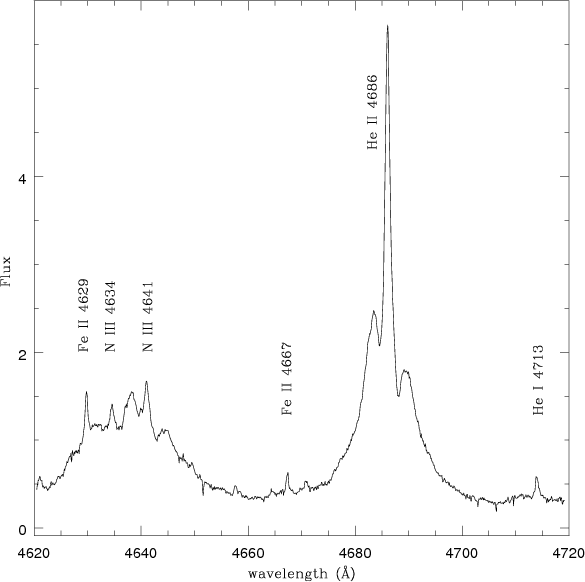 |
Figure 11: High dispersion spectrum on March 20: 4620-4720 Å. The unit of ordinate is 10-12 erg cm-2 s-1 Å-1. |
| Open with DEXTER | |
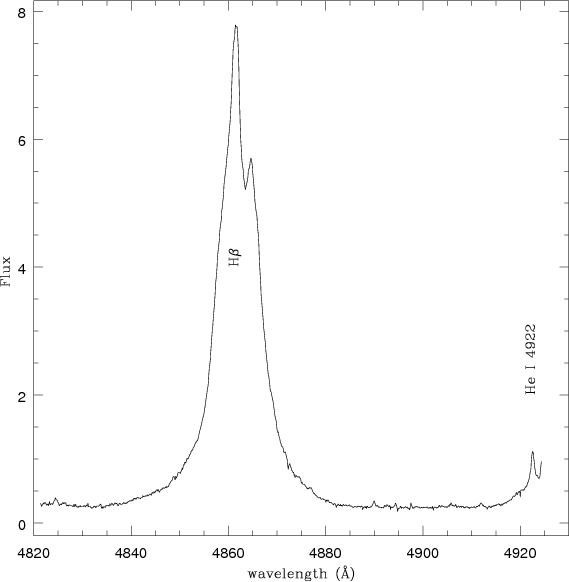 |
Figure 12:
Profile of H |
| Open with DEXTER | |
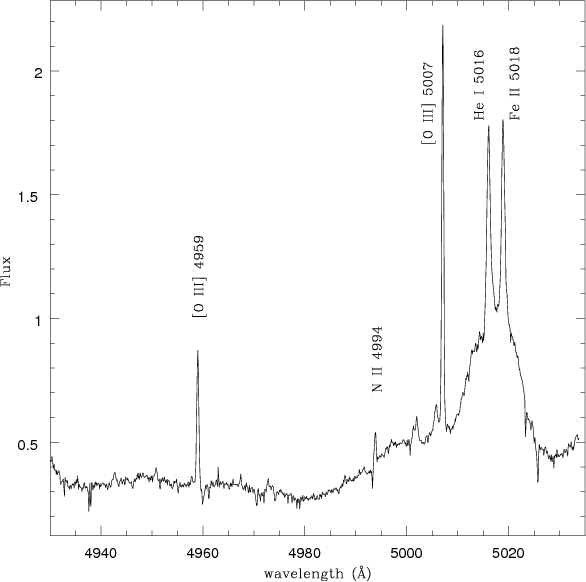 |
Figure 13: High dispersion spectrum on March 20: 4930-5030Å. The unit of ordinate is 10-12 erg cm-2 s-1 Å-1. |
| Open with DEXTER | |
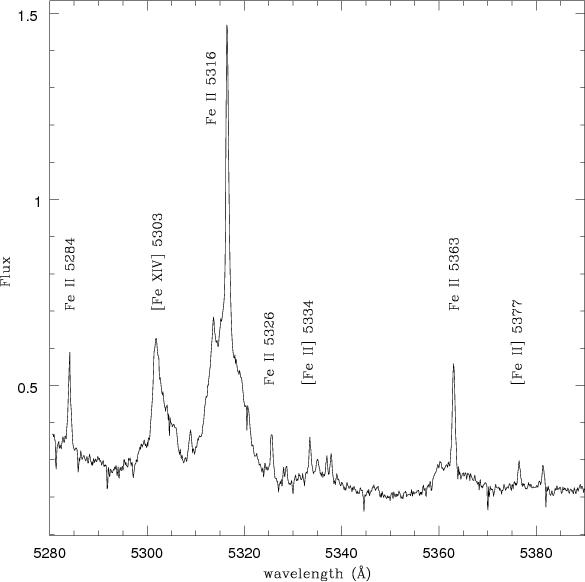 |
Figure 14: High dispersion spectrum on March 20: 5280-5390Å. The unit of ordinate is 10-12 erg cm-2 s-1 Å-1. |
| Open with DEXTER | |
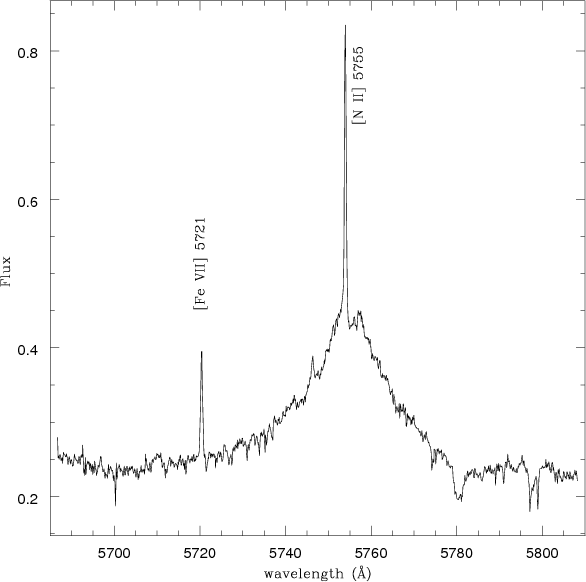 |
Figure 15: High dispersion spectrum on March 20: 5690-5810Å. The unit of ordinate is 10-12 erg cm-2 s-1 Å-1. |
| Open with DEXTER | |
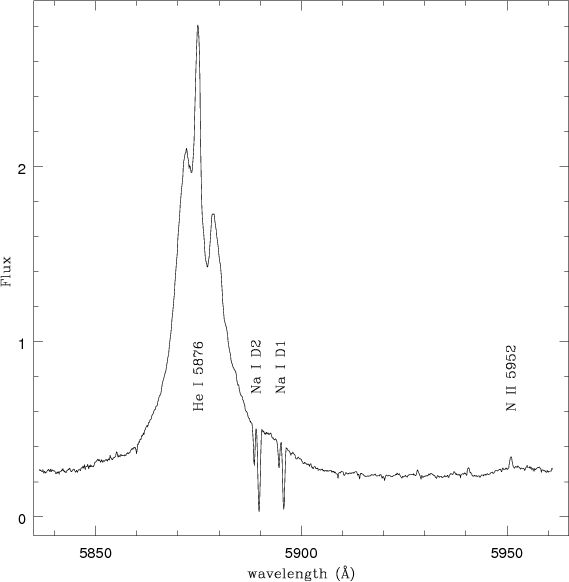 |
Figure 16: Profile of He I 5876 on March 20. The unit of ordinate is 10-12 erg cm-2 s-1 Å-1. |
| Open with DEXTER | |
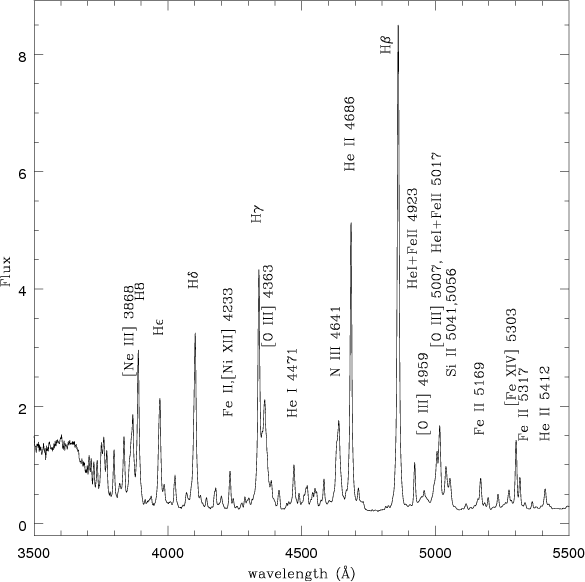 |
Figure 17: Medium dispersion blue spectrum on April 4. The unit of ordinate is 10-12 erg cm-2 s-1 Å-1. |
| Open with DEXTER | |
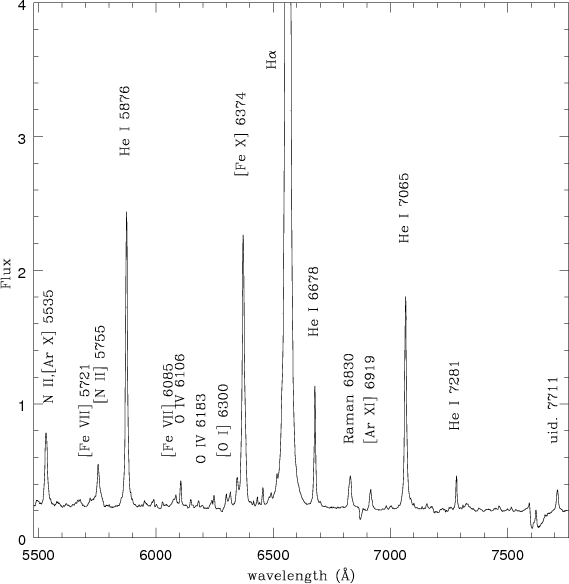 |
Figure 18: Medium dispersion red spectrum on April 4. The unit of ordinate is 10-12 erg cm-2 s-1 Å-1. |
| Open with DEXTER | |
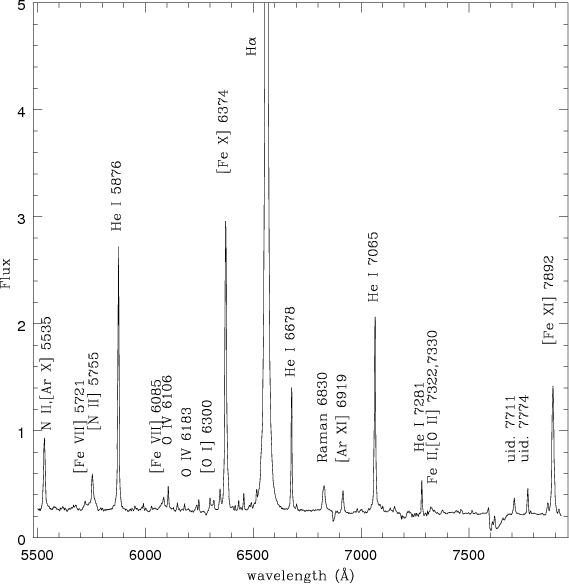 |
Figure 19: Medium dispersion red spectrum on April 24. The unit of ordinate is 10-12 erg cm-2 s-1 Å-1. |
| Open with DEXTER | |
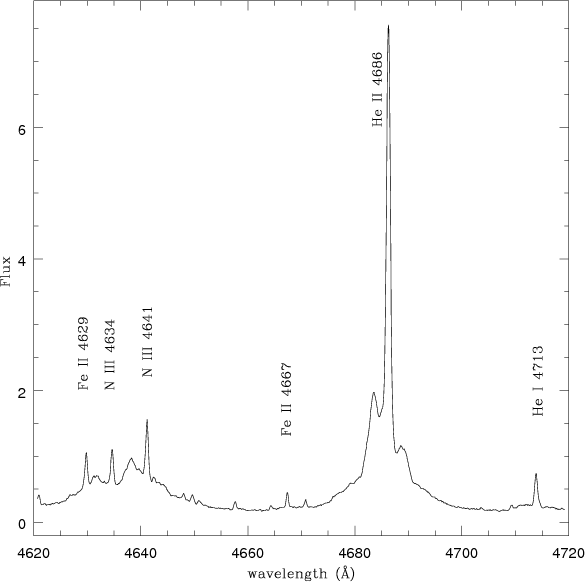 |
Figure 20: High dispersion spectrum on April 8: 4620-4720Å. The unit of ordinate is 10-12 erg cm-2 s-1 Å-1. |
| Open with DEXTER | |
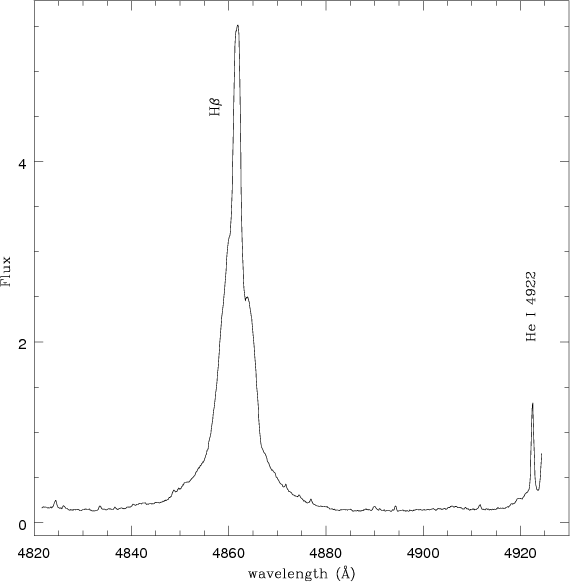 |
Figure 21:
High dispersion spectrum on April 8: profile of H |
| Open with DEXTER | |
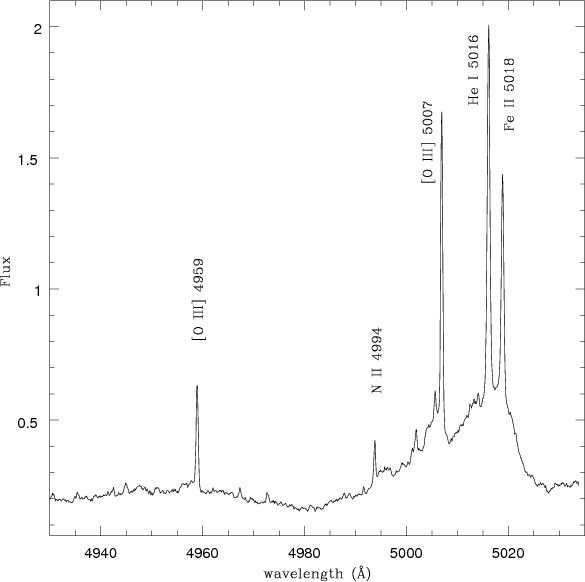 |
Figure 22: High dispersion spectrum on April 8: 4930-5030Å. The unit of ordinate is 10-12 erg cm-2 s-1 Å-1. |
| Open with DEXTER | |
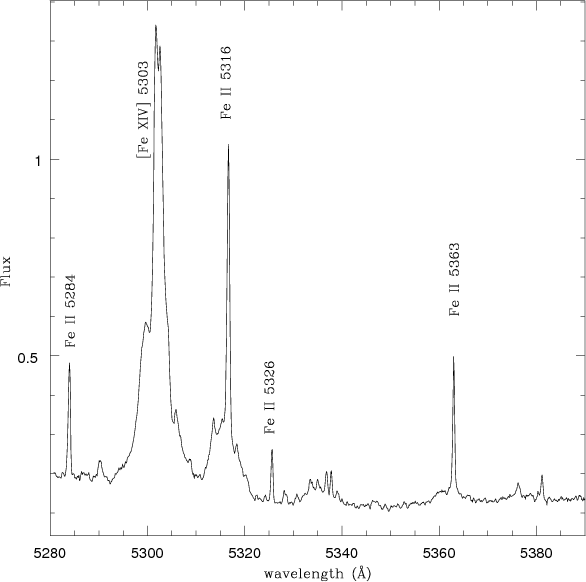 |
Figure 23: High dispersion spectrum on April 8: 5280-5390Å. The unit of ordinate is 10-12 erg cm-2 s-1 Å-1. |
| Open with DEXTER | |
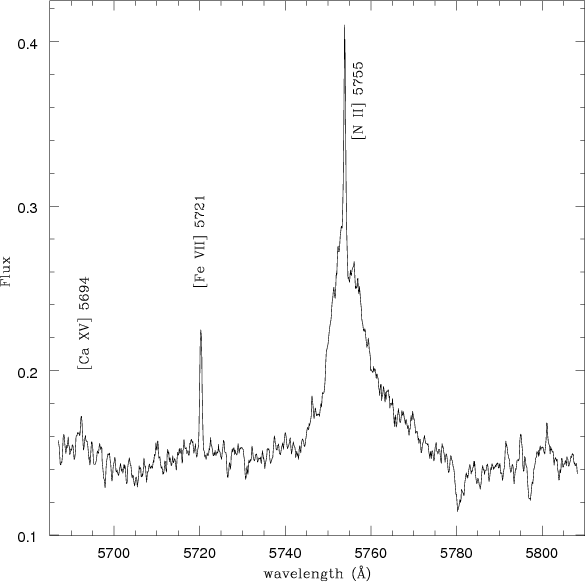 |
Figure 24: High dispersion spectrum on April 8: 5690-5810Å. The unit of ordinate is 10-12 erg cm-2 s-1 Å-1. |
| Open with DEXTER | |
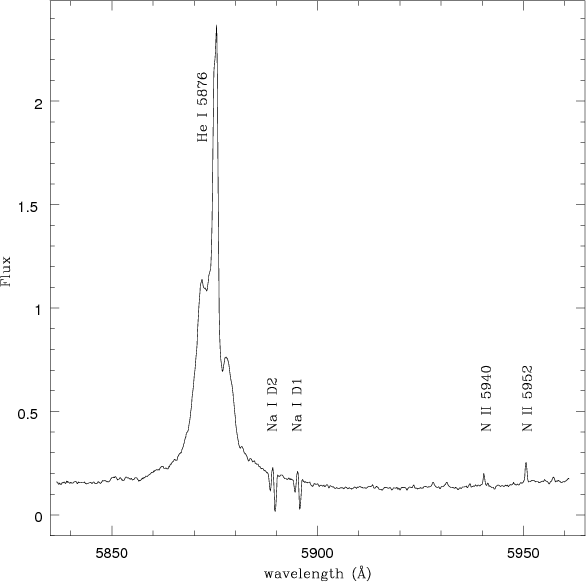 |
Figure 25: High dispersion spectrum on April 8: 5840-5960Å. The unit of ordinate is 10-12 erg cm-2 s-1 Å-1. |
| Open with DEXTER | |
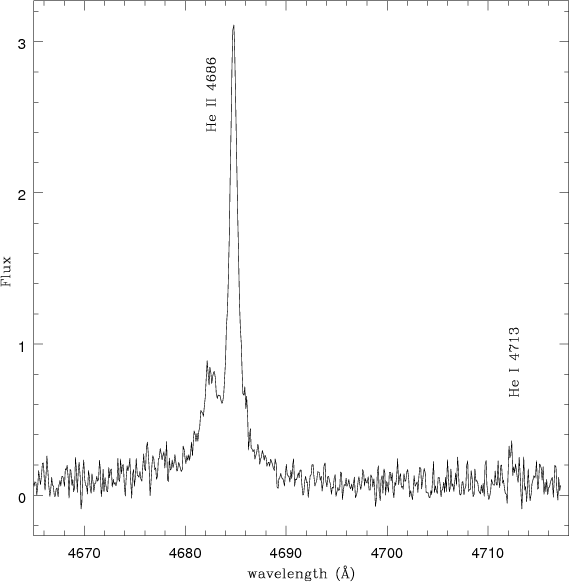 |
Figure 26: High dispersion spectrum on May 17: profile of He II 4686. The unit of the ordinate is 10-12 erg cm-2 s-1 Å-1. |
| Open with DEXTER | |
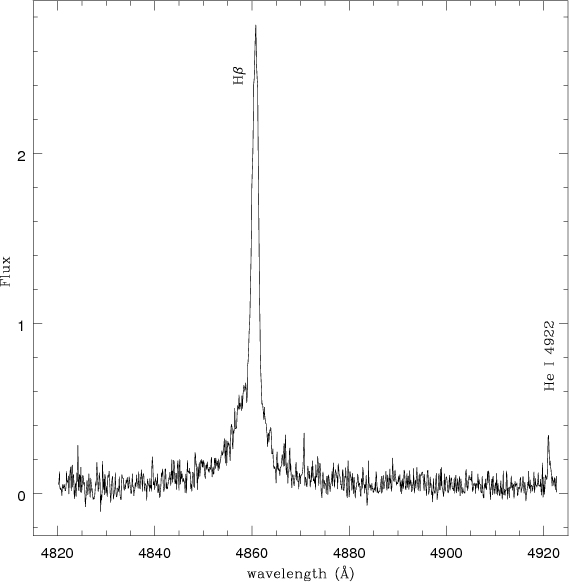 |
Figure 27:
High dispersion spectrum on May 17: profile of H |
| Open with DEXTER | |
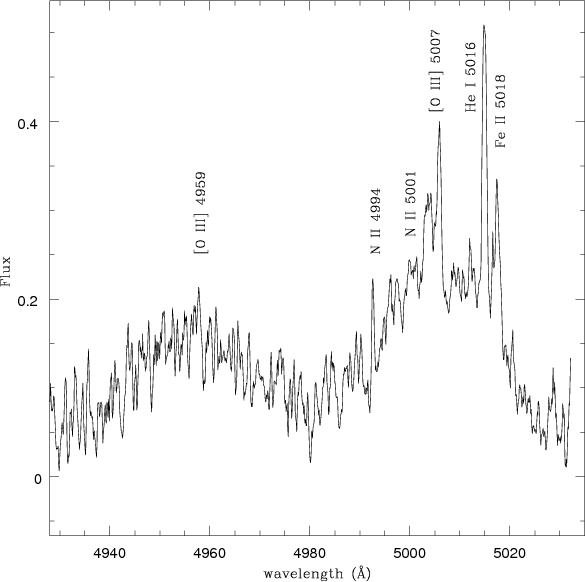 |
Figure 28: High dispersion spectrum on May 17: 4930-5030Å. The unit of ordinate is 10-12 erg cm-2 s-1 Å-1. |
| Open with DEXTER | |
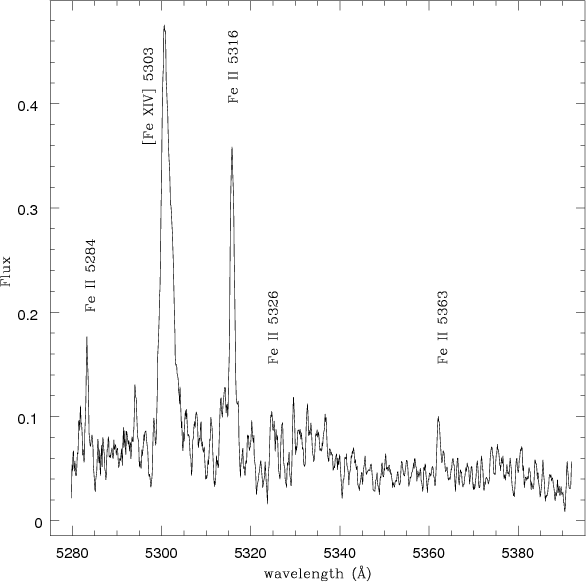 |
Figure 29: High dispersion spectrum on May 17: 5280-5390Å. The unit of ordinate is 10-12 erg cm-2 s-1 Å-1. |
| Open with DEXTER | |
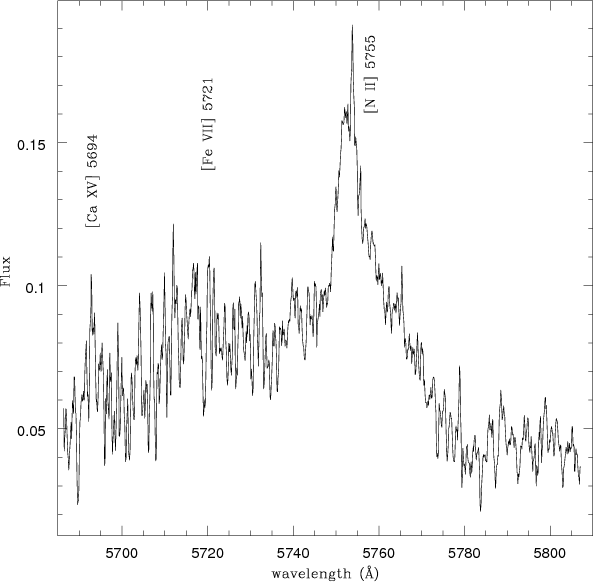 |
Figure 30: High dispersion spectrum on May 17: 5690-5810Å. The unit of ordinate is 10-12 erg cm-2 s-1 Å-1. |
| Open with DEXTER | |
 |
Figure 31: High dispersion spectrum on May 17: 5840-5955Å. The unit of ordinate is 10-12 erg cm-2 s-1 Å-1. |
| Open with DEXTER | |
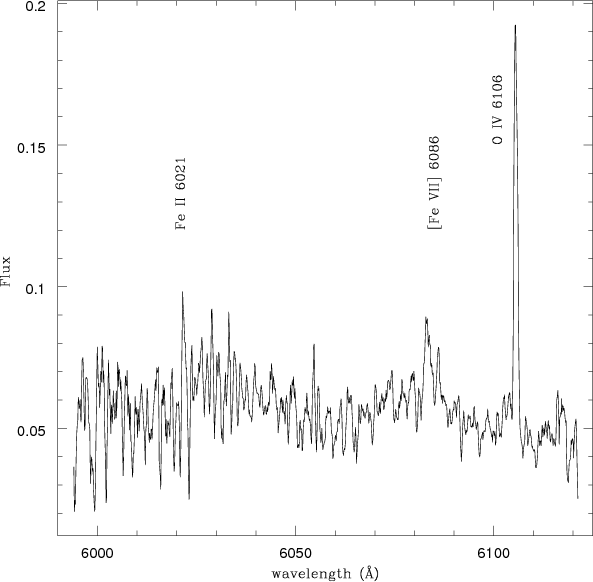 |
Figure 32: High dispersion spectrum on May 17: 6000-6120Å. The unit of ordinate is 10-12 erg cm-2 s-1 Å-1. |
| Open with DEXTER | |
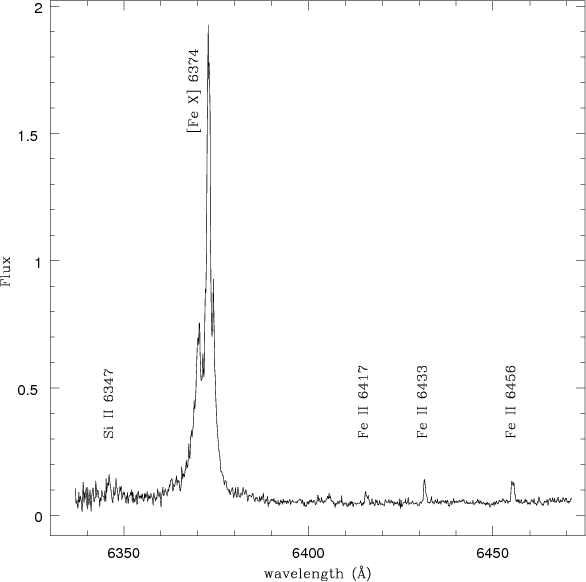 |
Figure 33: High dispersion spectrum on May 17: 6340-6470Å. The unit of ordinate is 10-12 erg cm-2 s-1 Å-1. |
| Open with DEXTER | |
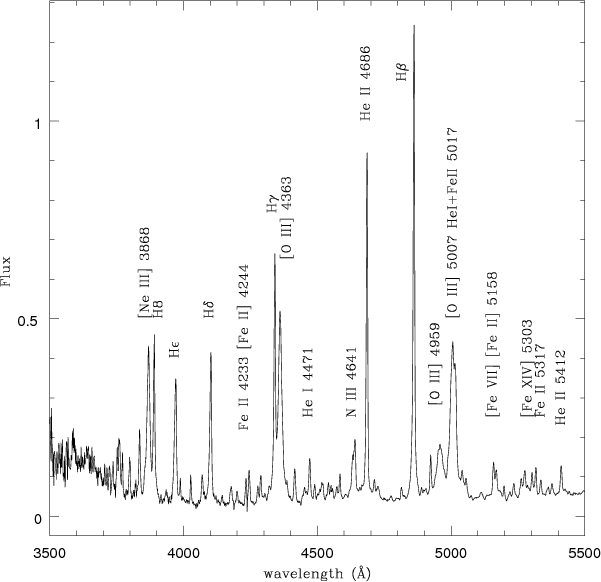 |
Figure 34: Medium dispersion blue spectrum on May 26. The unit of ordinate is 10-12 erg cm-2 s-1 Å-1. |
| Open with DEXTER | |
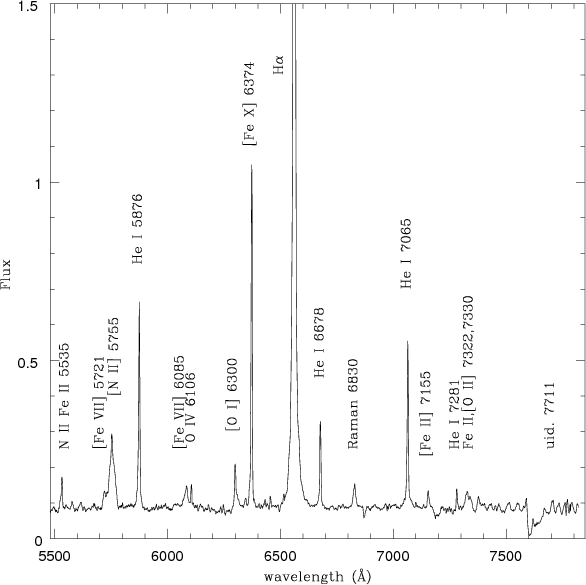 |
Figure 35: Medium dispersion red spectrum on May 25. The unit of ordinate is 10-12 erg cm-2 s-1 Å-1. |
| Open with DEXTER | |
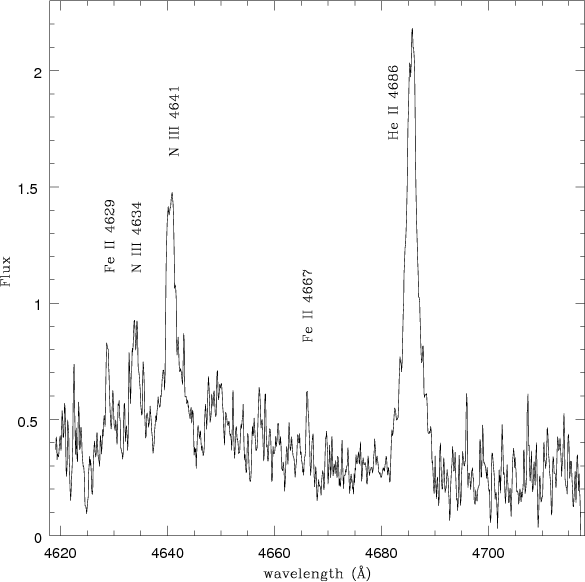 |
Figure 36: High dispersion spectrum on August 31: 4620-4720Å. The unit of the ordinate is 10-12 erg cm-2 s-1 Å-1. |
| Open with DEXTER | |
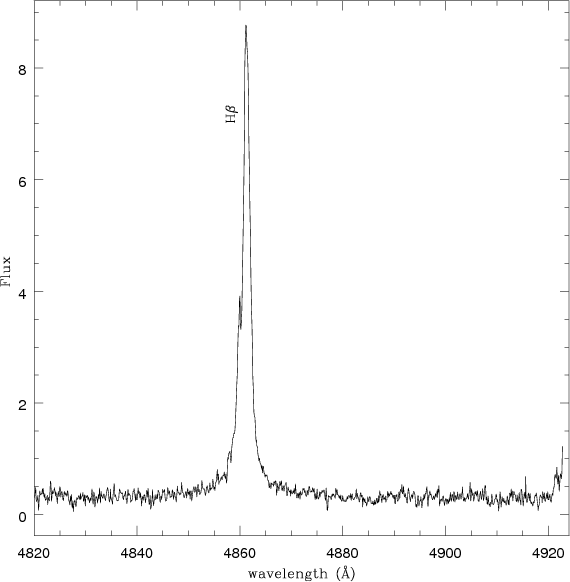 |
Figure 37:
High dispersion spectrum on August 31: profile of H |
| Open with DEXTER | |
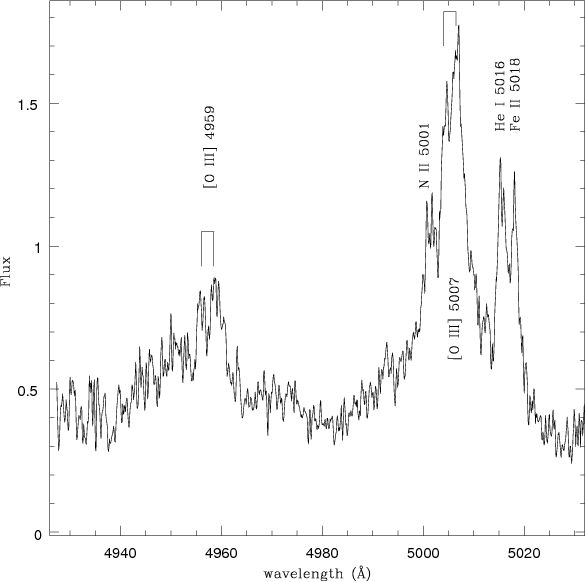 |
Figure 38: High dispersion spectrum on August 31: 4930-5030Å. The unit of the ordinate is 10-12 erg cm-2 s-1 Å-1. |
| Open with DEXTER | |
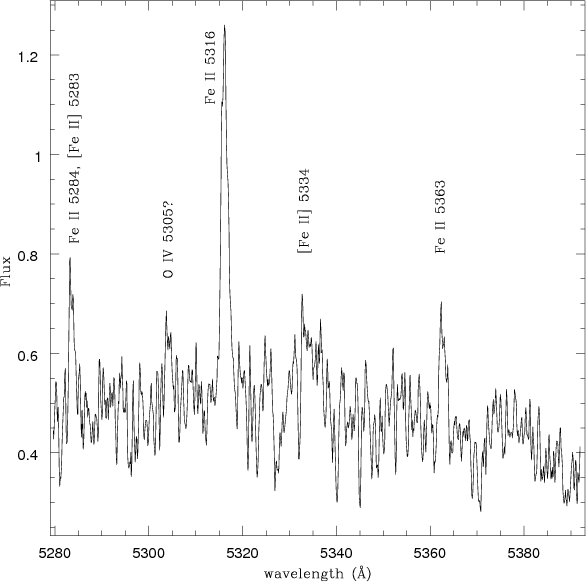 |
Figure 39: High dispersion spectrum on August 31: 5280-5390. The unit of the ordinate is 10-12 erg cm-2 s-1 Å-1. |
| Open with DEXTER | |
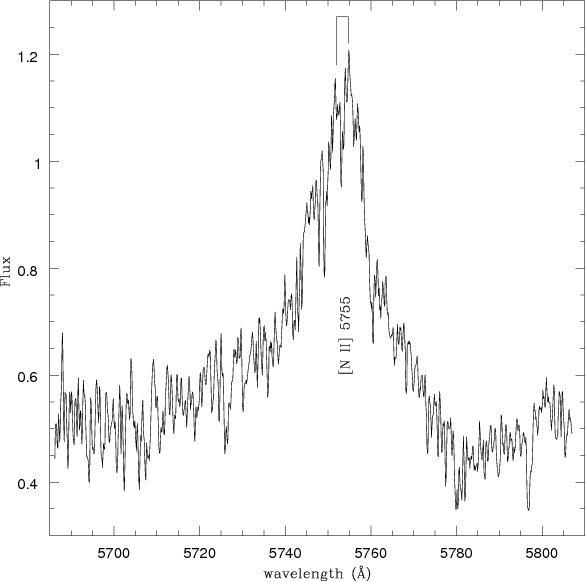 |
Figure 40: High dispersion spectrum on August 31: 5690-5805Å. The unit of the ordinate is 10-12 erg cm-2 s-1 Å-1. |
| Open with DEXTER | |
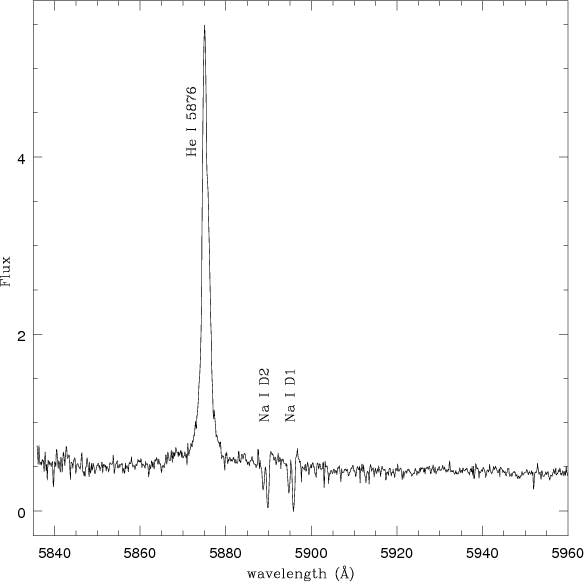 |
Figure 41: High dispersion spectrum on August 31: 5840-5960. The unit of the ordinate is 10-12 erg cm-2 s-1 Å-1. |
| Open with DEXTER | |
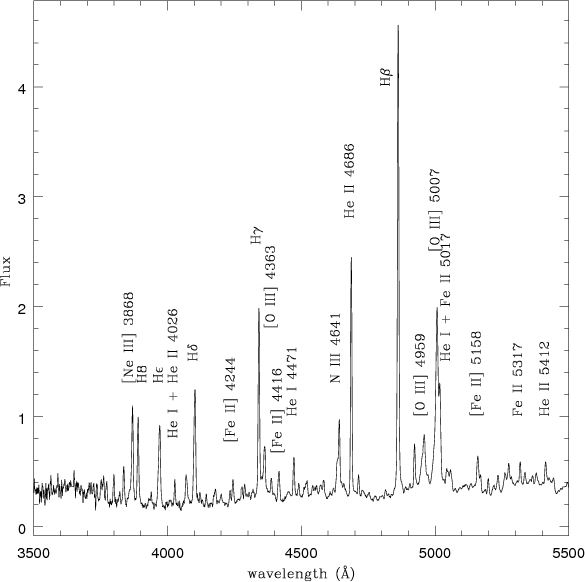 |
Figure 42: Medium dispersion blue spectrum on September 9. The unit of ordinate is 10-12 erg cm-2 s-1 Å-1. |
| Open with DEXTER | |
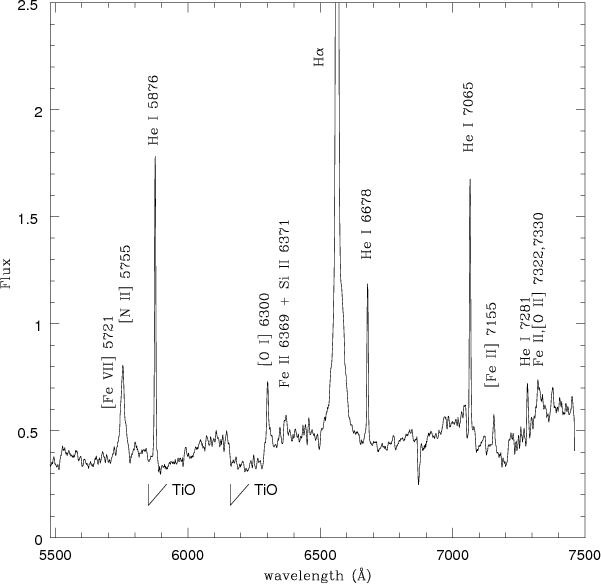 |
Figure 43: Medium dispersion red spectrum on September 12. The unit of ordinate is 10-12 erg cm-2 s-1 Å-1. |
| Open with DEXTER | |
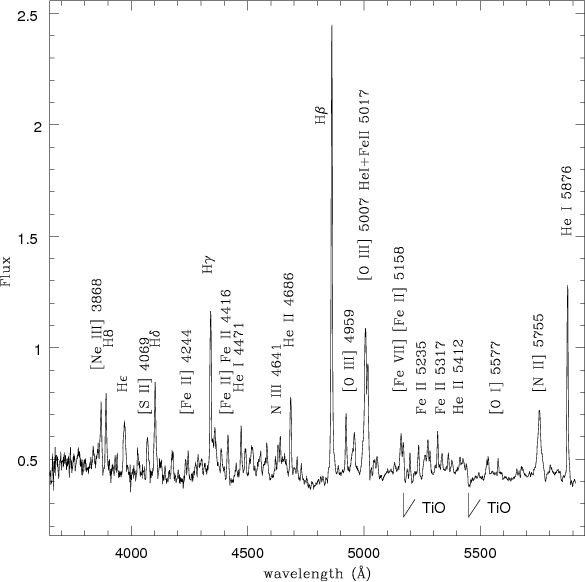 |
Figure 44: Medium dispersion blue spectrum on October 29. The unit of ordinate is 10-13 erg cm-2 s-1 Å-1. |
| Open with DEXTER | |
Current usage metrics show cumulative count of Article Views (full-text article views including HTML views, PDF and ePub downloads, according to the available data) and Abstracts Views on Vision4Press platform.
Data correspond to usage on the plateform after 2015. The current usage metrics is available 48-96 hours after online publication and is updated daily on week days.
Initial download of the metrics may take a while.