| Issue |
A&A
Volume 504, Number 2, September III 2009
|
|
|---|---|---|
| Page(s) | 605 - 615 | |
| Section | Planets and planetary systems | |
| DOI | https://doi.org/10.1051/0004-6361/200810097 | |
| Published online | 02 July 2009 | |
Online Material
Appendix A: Statistical evaluation of the model
A.1. Univariate tests on individual planet characteristics
Table 6: Mean values and standard deviations of the system parameters for the observed transiting planets and our simulated detections.
In this section, we detail the statistical method and tests that have been used to validate the model. We first perform basic tests of our model with simulations repeating multiple times the number of observations of the OGLE survey in order to get 50 000 detections. This number was chosen as a compromise between statistical significance and computation time. Table 6 compares the mean values and standard variations in the observations and in the simulations. The closeness of the values obtained for the two populations is an indication that our approach provides a reasonably good fit to the real stellar and planetary populations, and to the real planet compositions and evolution.
However, we do require more advanced statistical tests. First, we
use the so-called Student's t-test to formally compare the mean
values of all characteristics for both types of planets. The
intuition is that, should the model yield simulated planets of
attributes similar to real planets, the average values of these
attributes should not be significantly different from one another.
In other words, the so-called null hypothesis H0 is that the
difference of their mean is zero. Posing H0:
![]() where superscripts r and s denote real and simulated planets
respectively, and the alternative hypothesis
where superscripts r and s denote real and simulated planets
respectively, and the alternative hypothesis ![]() being the
complement
being the
complement ![]() :
:
![]() ,
we compute the tstatistics using the first and second moments of the distribution of
each planet characteristics as follows:
,
we compute the tstatistics using the first and second moments of the distribution of
each planet characteristics as follows:
 |
(2) |
where x is each of the planet characteristics, n is the size of each sample, and
Next, we perform the Kolmogorov-Smirnov test to allow for a more
global assessment of the compatibility of the two populations. This
test has the advantage of being non-parametric, making no assumption
about the distribution of data. This is particularly important since
the number of real planets remains small, which may alter the
normality of the distribution. Moreover, the Kolmogorov-Smirnov
comparison tests the stochastic dominance of the entire
distribution of real planets over simulated planets. To do so, it
computes the largest absolute deviations D between Fr(x), the
empirical cumulative distribution function of characteristics xfor real planets, and Fs(x) the cumulative distribution
function of characteristics x for simulated planets, over the
range of values of x:
![]() .
If the calculated D-statistic is greater than
the critical D*-statistic (provided by the Kolmogorov-Smirnov table: for 31
observations D*=0.19 for a 80% confidence level and D*=0.24 for a
95% confidence level), then one
must reject the null hypothesis that the two distributions are
similar,
H0: | Fr(x)-Fs(x) | <D*, and accept
.
If the calculated D-statistic is greater than
the critical D*-statistic (provided by the Kolmogorov-Smirnov table: for 31
observations D*=0.19 for a 80% confidence level and D*=0.24 for a
95% confidence level), then one
must reject the null hypothesis that the two distributions are
similar,
H0: | Fr(x)-Fs(x) | <D*, and accept
![]() .
Table 8 shows the
result of the test. The first column provides the D-Statistics, and
the second column gives the probability that the two samples have
the same distribution.
.
Table 8 shows the
result of the test. The first column provides the D-Statistics, and
the second column gives the probability that the two samples have
the same distribution.
Again, we find a good match between the model and observed samples: the parameters that have the least satisfactory fits are the planet's equilibrium temperature and the planet mass. These values are interpreted as being due to imperfections in the assumed star and planet populations. It is important to stress that although the extrasolar planets' main characteristics (period, mass) are well-defined by radial-velocity surveys, the subset of transiting planets is highly biased towards short periods and corresponds to a relatively small sample of the known radial-velocity planet population. This explains why the probability that the planetary mass is drawn from the same distribution in the model and in the observations is relatively low, which may otherwise seem surprising given that the planet mass distribution would be expected to be relatively well defined by the radial-velocity measurements.
A.2. Tests in two dimensions
Tests of the adequation of observations and models in two dimensions, i.e. when considering one parameter compared to another one can be performed using the method of maximum likelihood as described in Paper I. Table 9 provides values of the standard deviations from maximum likelihood for important combinations of parameters. The second column is a comparison using all planets discovered by transit surveys, and the third column using all known transiting planets (including those discovered by radial velocity).
The results are generally good, with deviations not exceeding
![]() .
They are also very similar when considering all
planets or only the subset discovered by photometric surveys. This
shows that the radial-velocity and photometric planet characteristics
are quite similar. The mass vs. radius relation shows the highest deviation,
as a few planets are outliers of our planetary evolution model.
.
They are also very similar when considering all
planets or only the subset discovered by photometric surveys. This
shows that the radial-velocity and photometric planet characteristics
are quite similar. The mass vs. radius relation shows the highest deviation,
as a few planets are outliers of our planetary evolution model.
A.3. Multivariate assessment of the performance of the model
A.3.1. Principle
Tests such as the Student-t statistics and the Kolmogorov-Smirnov test are important to determine the adequacy of given parameters, but they do not provide a multivariate assessment of the model. In order to globally assess the viability of our model we proceed as follows: We generate a list including 50 000 ``simulated'' planets and the 31 ``observed'' giant planets from Table 1. This number is necessary for an accurate multi-variate analysis (see Sect. A.3.2). A dummy variable Y is generated with value 1 if the planet is observed, 0 if the planet is simulated.
In order to test dependencies between parameters, we have presented in
Table 3 (Sect. 2.4) the Pearson
correlation coefficients between each variable including Y. A first
look at the table shows that the method correctly retrieves the
important physical correlations without any a priori information
concerning the links that exist between the different parameters. For
example, the stellar effective temperature
![]() is positively
correlated to the stellar mass
is positively
correlated to the stellar mass ![]() ,
and radius
,
and radius ![]() .
It is
also naturally positively correlated to the planet's equilibrium
temperature
.
It is
also naturally positively correlated to the planet's equilibrium
temperature
![]() ,
and to the planet's radius
,
and to the planet's radius ![]() simply because evolution models predict planetary radii that are
larger for larger values of the irradiation, all parameters being
equal. Interestingly, it can be seen that although the Safronov number
is by definition correlated to the planetary mass, radius, orbital
period and star mass (see Eq. (1)), the largest
correlation parameters for
simply because evolution models predict planetary radii that are
larger for larger values of the irradiation, all parameters being
equal. Interestingly, it can be seen that although the Safronov number
is by definition correlated to the planetary mass, radius, orbital
period and star mass (see Eq. (1)), the largest
correlation parameters for ![]() in absolute value are those related to
in absolute value are those related to ![]() and P (as the range of both these parameters vary by more
than one decade, while
and P (as the range of both these parameters vary by more
than one decade, while ![]() and
and ![]() only vary by a factor of
2). Also, we observe that the star metallicity is only correlated
to the planet radius. This is a consequence of our assumption that a
planet's heavy element content is directly proportional to the star's
[Fe/H], and of the fact that planets with more heavy elements are
smaller, all other parameters being equal. The planet's radius is
itself correlated negatively with [Fe/H] and positively with
only vary by a factor of
2). Also, we observe that the star metallicity is only correlated
to the planet radius. This is a consequence of our assumption that a
planet's heavy element content is directly proportional to the star's
[Fe/H], and of the fact that planets with more heavy elements are
smaller, all other parameters being equal. The planet's radius is
itself correlated negatively with [Fe/H] and positively with
![]() ,
,
![]() ,
,![]() and
and
![]() .
Table 3 also shows the correlations with
the ``reality'' parameter. Of course, a satisfactory model is one in
which there is no correlation between this reality parameter and other
physical parameters of the model. In our case, the corresponding
correlation coefficients are always small and indicate a good match
between the two populations.
.
Table 3 also shows the correlations with
the ``reality'' parameter. Of course, a satisfactory model is one in
which there is no correlation between this reality parameter and other
physical parameters of the model. In our case, the corresponding
correlation coefficients are always small and indicate a good match
between the two populations.
Table 7: Test of equality of means. Student's t value and critical probabilities p that individual parameters for both real and simulated planets have the same sample mean.
Table 8: Kolmogorov-Smirnov tests. D-statistics and critical probabilities that individual parameters for both real and simulated planets have the same distribution.
Table 9: Standard deviations from maximum likelihood of the model and observed transiting planet populations
Obviously the unconditional probability that a given planet is real
is
![]() .
Now we wish to know whether this
probability is sensitive to any of the planet characteristics,
controlling for all planet characteristics at once. Hence we model
the probability that a given planet is ``real'' using the logistic
cumulative density function as follows:
.
Now we wish to know whether this
probability is sensitive to any of the planet characteristics,
controlling for all planet characteristics at once. Hence we model
the probability that a given planet is ``real'' using the logistic
cumulative density function as follows:
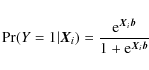
where
Importantly, an ordinary least square estimator should not be used in
this framework, due to the binary nature of the dependent
variables. Departures from normality and predictions outside the
range [0;1] are the quintessential motivations. Instead, Eq. (4) can be estimated using maximum likelihood
methods. The so-called logit specification (Greene 2000) fits
the parameter estimates ![]() so as to maximize the log
likelihood function:
so as to maximize the log
likelihood function:
![\begin{displaymath}\log L({\vec{Y}}\vert{\vec{X,{b}}}) = \sum\limits_{i = 1}^n
{...
...^n {\log
\left[ {1 + {\rm e}^{{\vec{X}_i\vec{b} }} } \right]}.
\end{displaymath}](/articles/aa/olm/2009/35/aa10097-08/img115.png) |
(5) |
The
Two features of logistic regression using
maximum likelihood estimators are important. First, the
value added by the exercise is that the multivariate approach allows
us to hold all other planet characteristics constant, extending the
bivariate correlations to the multivariate case. In other words, we
control for all planet characteristics at once. Second, one can test
whether a given parameter estimate is equal to 0 with the usual null
hypothesis H0: b=0 versus ![]() :
:
![]() .
The variance of
the estimator
.
The variance of
the estimator![]() is used
to derive the standard error of the parameter estimate.
Using Eq. (6), dividing each variable
is used
to derive the standard error of the parameter estimate.
Using Eq. (6), dividing each variable
![]() by the standard error
by the standard error
![]() yields
the t-statistics and allows us to test H0. We note
yields
the t-statistics and allows us to test H0. We note
![]() the probability that a higher value of t would occur by chance. This probability is evaluated for each explanatory variable
j. Should our model perform well, we would expect the t value
of each parameter estimate to be null, and the corresponding
probability
the probability that a higher value of t would occur by chance. This probability is evaluated for each explanatory variable
j. Should our model perform well, we would expect the t value
of each parameter estimate to be null, and the corresponding
probability
![]() to be close to one. This would imply no
significant association between a single planet characteristics and
the event of being a ``real'' planet.
to be close to one. This would imply no
significant association between a single planet characteristics and
the event of being a ``real'' planet.
The global probability that the model and
observations are compatible can be estimated. To do so, we compute
the log likelihood obtained when bj=0for j=1..m, where m is the number of variables. Following
Eq. (6):
![\begin{displaymath}
\log L({\vec{Y}}\vert 1,b_0) = \sum\limits_{i = 1}^n
{y_i b_...
...um\limits_{i = 1}^n {\log
\left[ {1 + {\rm e}^{b_0}} \right]}.
\end{displaymath}](/articles/aa/olm/2009/35/aa10097-08/img125.png)
The maximum of this quantity is
| (7) |
follows a
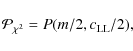 |
(8) |
where P(k,z) is the regularized Gamma function (e.g. Abramowitz & Stegun (1964)).
A.3.2. Determination of the number of model planets required
A problem that arose in the course of the present work was to evaluate
the number of model planets that were needed for the logit evaluation.
It is often estimated that about 10 times more model points than
observations are sufficient for a good tests. We found that
this relatively small number of points indeed leads to a valid
identification of the explanatory variables that are problematic,
i.e. those for which the ![]() coefficient is significantly
different from 0 (if any). However, the evaluation of the global
coefficient is significantly
different from 0 (if any). However, the evaluation of the global
![]() probability was then found to show considerable statistical
variability, probably given the relatively large number of explanatory
variables used for the study.
probability was then found to show considerable statistical
variability, probably given the relatively large number of explanatory
variables used for the study.
In order to test how the probability
![]() depends on the size
n of the sample to be analyzed, we first generated a very large list
of N0 simulated planets with CoRoTlux. We generated with
Monte-Carlo simulations a smaller subset of
depends on the size
n of the sample to be analyzed, we first generated a very large list
of N0 simulated planets with CoRoTlux. We generated with
Monte-Carlo simulations a smaller subset of
![]() simulated planets that
was augmented by the n1=31 observed planets and computed
simulated planets that
was augmented by the n1=31 observed planets and computed
![]() using the logit procedure. This exercise was performed 1000 times, and the results are
shown in Fig. 13. The resulting
using the logit procedure. This exercise was performed 1000 times, and the results are
shown in Fig. 13. The resulting
![]() is
found to be very variable for a sample smaller than
is
found to be very variable for a sample smaller than ![]() 20 000 planets. As a consequence, we chose to present tests performed for
n0=50 000 model planets.
20 000 planets. As a consequence, we chose to present tests performed for
n0=50 000 model planets.
![\begin{figure}
\par\includegraphics[width=6.5cm,clip]{10097f14.eps}
\end{figure}](/articles/aa/olm/2009/35/aa10097-08/img132.png) |
Figure 13:
Values of the |
| Open with DEXTER | |
A.3.3. Analysis of two CoRoTlux samples
Table 4 (see Sect. 2.4) reports the
parameter estimates for each of the planet/star characteristics. We
start by assessing the general quality of the logistic regression by
performing the chi-square test. If the vector of planet
characteristics brings no or little information as to which type of
planets a given observation belongs, we would expect the logistic
regression to perform badly. In technical terms, we would expect the
conditional probability
![]() to be equal to the
unconditional probability
to be equal to the
unconditional probability
![]() .
The
.
The ![]() test described
above is used to evaluate the significance of the
model.
test described
above is used to evaluate the significance of the
model.
We performed several tests: the first column of results in
Table 10 shows the result of a logit
analysis with the whole series of 9 explanatory variables. Globally,
the model behaves well, with a likelihood statistic ratio
![]() and a
and a ![]() distribution for 9 degrees of freedom
yielding a probability
distribution for 9 degrees of freedom
yielding a probability
![]() .
When examining
individual variables, we find that the lowest probability derived from
the Student test is that of [Fe/H]:
.
When examining
individual variables, we find that the lowest probability derived from
the Student test is that of [Fe/H]:
![]() ,
implying that the stellar metallicity is not well reproduced. As
discussed previously, this is due to the fact that several planets of
the observed list have no or very poorly constrained determinations of
the stellar [Fe/H], and so a default value of 0 was then used.
,
implying that the stellar metallicity is not well reproduced. As
discussed previously, this is due to the fact that several planets of
the observed list have no or very poorly constrained determinations of
the stellar [Fe/H], and so a default value of 0 was then used.
The other columns in Table 10 show the
result of the logit analysis when removing one variable (i.e. with
only 8 explanatory variables). In agreement with the above analysis,
the highest global probability
![]() is obtained for the
model without the [Fe/H] variable. When removing other variables, the
results are very homogeneous, indicating that although the model can
certainly be improved, there is no readily identified problem except
that for [Fe/H]. We hope that future observations will allow for
better constraints on these stars' metallicities.
is obtained for the
model without the [Fe/H] variable. When removing other variables, the
results are very homogeneous, indicating that although the model can
certainly be improved, there is no readily identified problem except
that for [Fe/H]. We hope that future observations will allow for
better constraints on these stars' metallicities.
In order to further test the method, we show in
Table 11 the results of an analysis in which
the model radii where artificially augmented by 10%. The
corresponding probabilities are significantly lower: we
find that the model can explain the observations by chance only in
less than 1/10 000. The probabilities for each variable are affected
as well so that it is impossible to identify the culprit for the bad
fit with the 9 variables. However, when removing ![]() from the
analysis sample, the fit becomes significantly better. Note that
the results for that column are slightly different of those for the
same column in Table 10 because of the
dependance of
from the
analysis sample, the fit becomes significantly better. Note that
the results for that column are slightly different of those for the
same column in Table 10 because of the
dependance of ![]() on
on ![]() .
.
Table 10: Results of the logit analysis for the fiducial model with 50 000 model planets and 31 observations.
Table 11:
Results of the logit analysis for the altered model (![]() increased by 10%) with 50 000 model planets and 31
observations.
increased by 10%) with 50 000 model planets and 31
observations.
Current usage metrics show cumulative count of Article Views (full-text article views including HTML views, PDF and ePub downloads, according to the available data) and Abstracts Views on Vision4Press platform.
Data correspond to usage on the plateform after 2015. The current usage metrics is available 48-96 hours after online publication and is updated daily on week days.
Initial download of the metrics may take a while.