


Fig. 4
Download original image
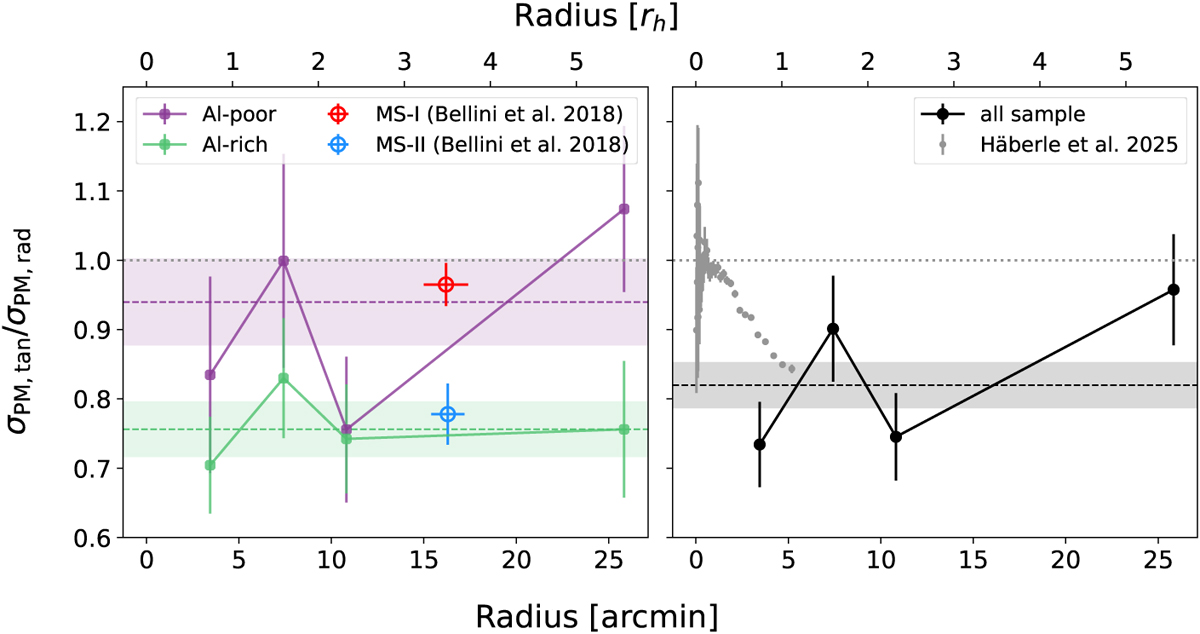
Radial anisotropy profiles of the two chemically defined populations. Left panel: σPM,tan/σPM,rad as a function of radius for the Al-poor and Al-rich stars. The shaded bands mark the corresponding global values from bottom left panel of Fig. 3. The HST-based measurements of the MS-I and MS-II populations from Bellini et al. (2018) are overplotted for comparison. Right panel: combined sample, compared to the oMEGACat profile from Häberle et al. (2025).
Current usage metrics show cumulative count of Article Views (full-text article views including HTML views, PDF and ePub downloads, according to the available data) and Abstracts Views on Vision4Press platform.
Data correspond to usage on the plateform after 2015. The current usage metrics is available 48-96 hours after online publication and is updated daily on week days.
Initial download of the metrics may take a while.